
CCSS IP Math I 4.3.2 Example 1: Correlation Coefficient for Data Relationship St
Loading the math board and drawing, please wait…
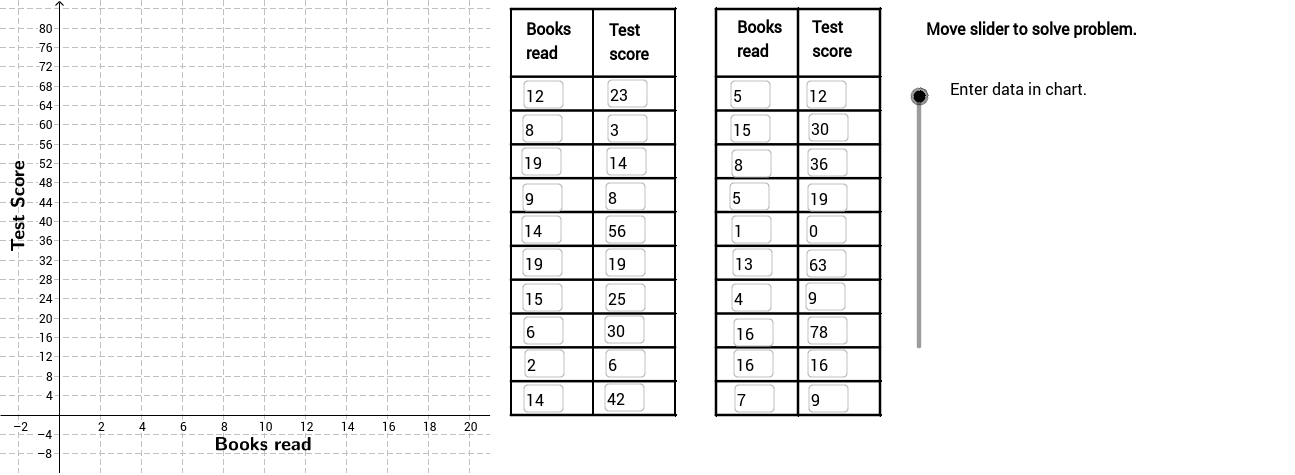
① This example shows how to plot a scatter diagram, fit a least‑squares regression line with FitLineY, and compute the Pearson correlation coefficient (PMCC) to quantify the strength of the linear relationship between two data sets. ② Key mathematical concepts: correlation coefficient, linear regression, scatter‑plot analysis, and measures of association. ③ Construction highlights: Sequence creates 21 points (A1–A21, B1–B19); FitLineY draws the regression line; PMCC evaluates the correlation; Segment, If, Polygon, RotateText, and Textfield handle conditional segments, annotations, and dynamic labels. ④ Suitable for high‑school statistics (CCSS Math I), introductory college statistics, and any data‑visualization demonstration.
GeoGebra Commands & Parameters
FitLineY(PointList1) → LineFitPMCC(PointList1) → CorCoeffTextfield(A2) → InA2Textfield(A3) → InA3Textfield(A4) → InA4Textfield(A5) → InA5Textfield(A6) → InA6Textfield(A7) → InA7Textfield(A8) → InA8Textfield(A9) → InA9Textfield(A10) → InA10Textfield(A11) → InA11Textfield(A12) → InA12Textfield(A13) → InA13Textfield(A14) → InA14Textfield(A15) → InA15Textfield(A16) → InA16Textfield(A17) → InA17Textfield(A18) → InA18Textfield(A19) → InA19Textfield(A20) → InA20Textfield(A21) → InA21Textfield(B2) → InB2Textfield(B3) → InB3Textfield(B4) → InB4Textfield(B5) → InB5Textfield(B6) → InB6Textfield(B7) → InB7Textfield(B8) → InB8Textfield(B9) → InB9Textfield(B10) → InB10Textfield(B11) → InB11Textfield(B12) → InB12Textfield(B13) → InB13Textfield(B14) → InB14Textfield(B15) → InB15Textfield(B16) → InB16Textfield(B17) → InB17Textfield(B18) → InB18Textfield(B19) → InB19Textfield(B20) → InB20Textfield(B21) → InB21Sequence(Segment[(22, 0 + 7 * i), (30, 0 + 7 * i)], i, 0, 10) → Linesh1Sequence(Segment[(32, 0 + 7 * i), (40, 0 + 7 * i)], i, 0, 10) → Linesh2Sequence(Segment[(22 + 4 * i, 0), (22 + 4 * i, 84)], i, 0, 2) → Linesv1Sequence(Segment[(32 + 4 * i, 0), (32 + 4 * i, 84)], i, 0, 2) → Linesv2Segment((22, 84), (30, 84)) → top1Segment((32, 84), (40, 84)) → top2If(LineVisible, "Hide Best Fit Line", "Show Best Fit Line") → LineButtonPolygon((21, y(Corner[1])), Corner[2], Corner[3], (21, y(Corner[4]))) → poly1, a, b, c, dRotateText("Test Score", 90*°) → SideLegendRotateText("Books read", 0) → BottomLegendIf(CorVisible, "Hide Correlation Coefficient", "Show Correlation Coefficient") → CorButton