
Cars Meeting Story Graph
Loading the math board and drawing, please wait…
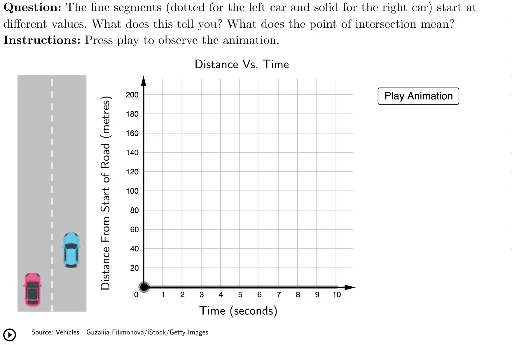
This example demonstrates a story graph of two cars meeting. Core mathematical concepts include function graphs and vectors. Using GeoGebra commands such as Polygon, Vector, and Segment, the movement trajectories of two cars can be constructed. Suitable for high school mathematics education, particularly in coordinate geometry and function graphing.
GeoGebra Commands & Parameters
Polygon({(-2, 217), (10.9, 217), (10.9, -20), (-2, -20)}) → viewBoxLaTeX((((("\text{" * QUESTION) * "\\") * INSTRUCTIONS) * "}")) → TEXTPolygon({(-6.5, -25), (-6.5, 220), (-3, 220), (-3, -25)}) → roadVector((0, 0), (0, 220)) → yAxisVectorVector((0, 0), (11, 0)) → xAxisVectorLaTeX("\text{Time (seconds)}") → xLabelSegment((-4.75, -25), (-4.75, 220)) → roadDividerLaTeX("\text{Source: Vehicles - Guzaliia Filimonova/iStock/Getty Images}") → copyrightLaTeX(UnicodeToLetter[10003]) → cmarkLaTeX(UnicodeToLetter[10007]) → xmarkLaTeX("\text{Distance Vs. Time}") → titleRotateText(LaTeX["\text{Distance From Start of Road (metres)}"], 90°) → yLabel
AI Drawing Prompt Reference
Draw a chart showing the movement trajectories of two cars, including a view box, a road, a Y-axis and an X-axis, a time label, a road divider, a title, and a distance label. The view box is at the bottom left, the road extends from the top left to the bottom right, the Y-axis is perpendicular to the X-axis, the X-axis is horizontal, the time label is above the X-axis, the distance label is to the left of the Y-axis, and the title is in the center above the chart.
The prompt above was compiled from the original drawing commands and is for reference only.