
Car Reversing Story Graph
Loading the math board and drawing, please wait…
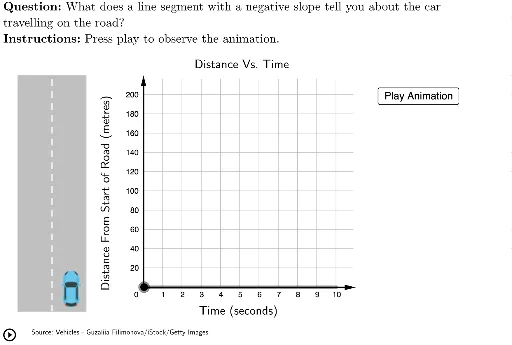
This example demonstrates the position changes of a car reversing, involving function graphs, translation, and logic. Using commands like Polygon, Vector, and Segment in GeoGebra, the dynamic changes in the car's position during reversing are illustrated. Suitable for high school mathematics education, particularly for teaching function graphs and logic.
GeoGebra Commands & Parameters
Polygon({(-2, 217), (10.9, 217), (10.9, -20), (-2, -20)}) → viewBoxLaTeX((((("\text{" * QUESTION) * "\\") * INSTRUCTIONS) * "}")) → TEXTPolygon({(-6.5, -25), (-6.5, 220), (-3, 220), (-3, -25)}) → roadVector((0, 0), (0, 220)) → yAxisVectorVector((0, 0), (11, 0)) → xAxisVectorLaTeX("\text{Time (seconds)}") → xLabelSegment((-4.75, -25), (-4.75, 220)) → roadDividerLaTeX("\text{Source: Vehicles - Guzaliia Filimonova/iStock/Getty Images}") → copyrightLaTeX(UnicodeToLetter[10003]) → cmarkLaTeX(UnicodeToLetter[10007]) → xmarkLaTeX("\text{Distance Vs. Time}") → titleRotateText(LaTeX["\text{Distance From Start of Road (metres)}"], 90°) → yLabel