
Capacitor Discharging: Exponential Decay Graphs and Tangent Interpretation
Loading the math board and drawing, please wait…
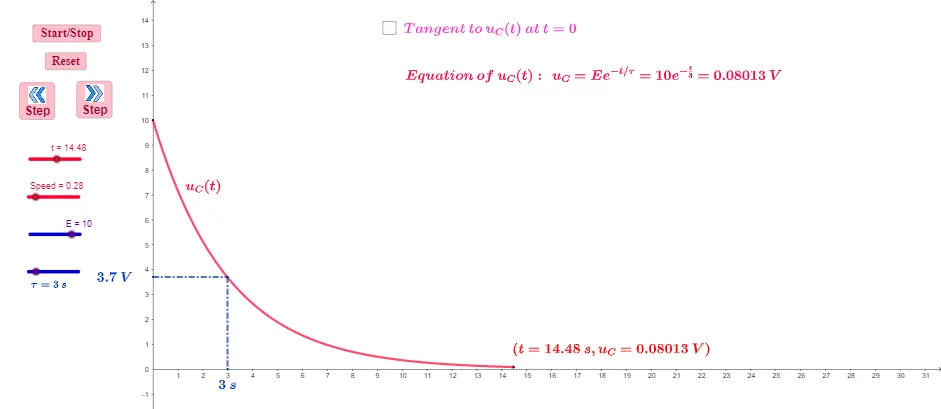
This example demonstrates the discharging process of a capacitor by modeling how charge or voltage decays over time and visualizing it as an exponential decay curve. It highlights key mathematical ideas: exponential functions, function graphing, and the geometric meaning of a tangent line (local rate/change captured by the tangent). The construction uses GeoGebra’s geometry tools—especially the command “Segment”—to build essential elements such as time-parameter positions and connecting segments, along with labeled objects (e.g., E, t, Γ, a, A, M, f, B, C, b, D, g, h, i, and multiple text labels) to annotate the graph and indicate relevant points/lines. Interactive controls (button objects) support step-by-step exploration of the curve and its tangent interpretation. Suitable for upper-secondary students through early university learners, particularly for teaching exponential models, graph interpretation, and an intuitive introduction to calculus concepts via tangents.
GeoGebra Commands & Parameters
Segment(B, C) → gSegment(C, D) → hSegment(A, D) → i
AI Drawing Prompt Reference
Draw a graph showing the discharging process of a capacitor, featuring an exponential decay curve that models the decay of charge or voltage over time. Mark key points on the curve and connect them with line segments to form geometric structures. Include a slider for time parameter control and a tangent line to illustrate the local rate of change, labeling relevant mathematical concepts and graph elements like time, voltage, and the tangent for understanding exponential functions and calculus ideas.
The prompt above was compiled from the original drawing commands and is for reference only.