
Charging of a Capacitor: Dynamic Exponential Function Visualization
Loading the math board and drawing, please wait…
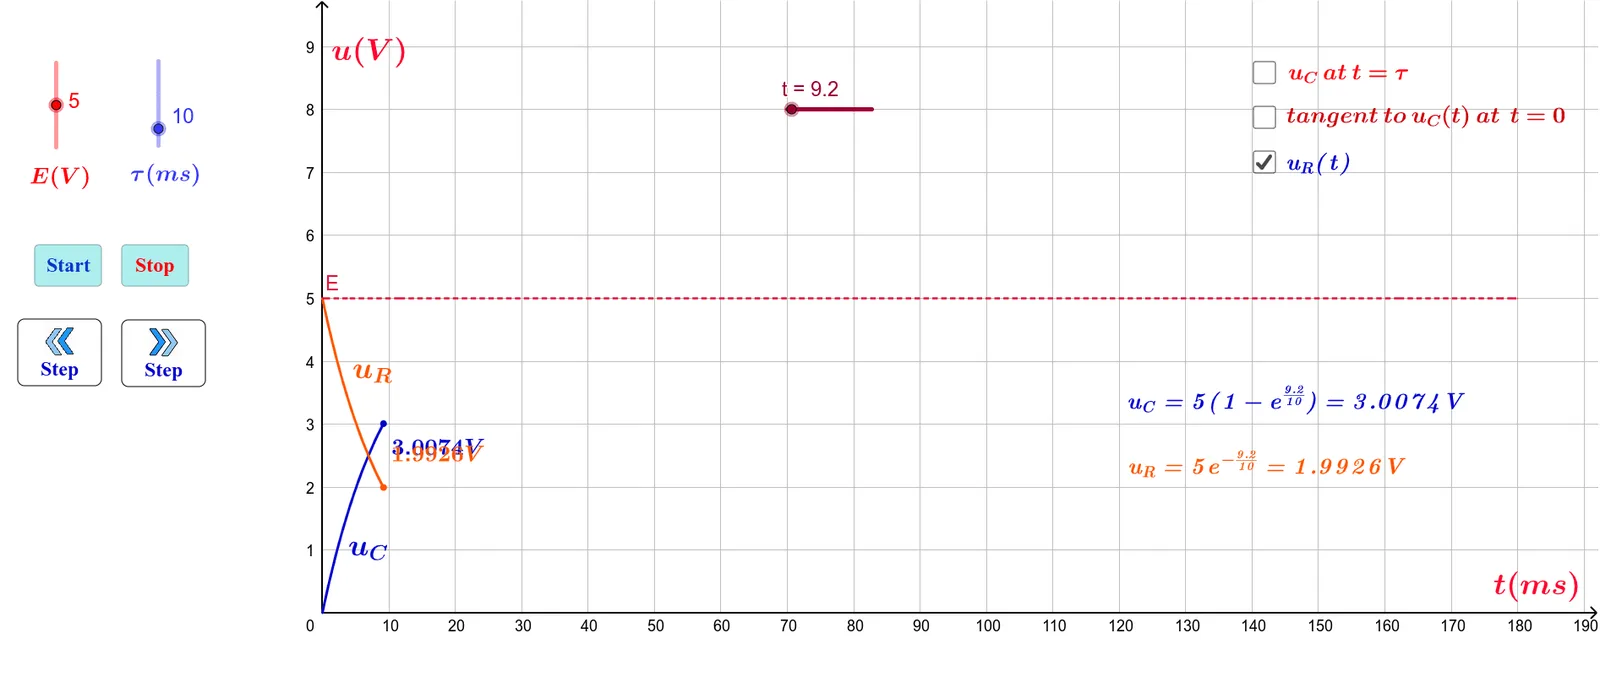
① This GeoGebra example dynamically demonstrates the charging process of a capacitor, showing the exponential growth of voltage or charge over time as a function graph. ② Core mathematical concepts include exponential functions, function graphing, calculus (derivatives and integrals), and geometric elements such as rotation, centroid, cylinder, and rhombus, linking physics to mathematical modeling. ③ Construction details: The example uses commands like OrthogonalLine, Intersect, and Segment to build auxiliary geometry, along with sliders (τ, t) and buttons (button1-4) to control parameters and animation, and text objects (text1-15) to display values and formulas, resulting in an interactive dynamic visualization. ④ Suitable for high school to university-level teaching in physics and mathematics, ideal for explaining RC circuits, exponential growth models, differential equations, and the integration of function graphs with geometric constructions.
GeoGebra Commands & Parameters
OrthogonalLine(P, xAxis) → iIntersect(i, xAxis) → BSegment(P, B) → j
AI Drawing Prompt Reference
Create a dynamic visualization showing the charging process of a capacitor, illustrating the exponential growth of voltage or charge over time as a function graph. Include an auxiliary line perpendicular to the x-axis through point P, its intersection with the x-axis at point B, and a line segment connecting P and B to construct auxiliary geometry, depicting the dynamic change of the exponential function.
The prompt above was compiled from the original drawing commands and is for reference only.