
Candy Bar Measurement by Arthur Lee (2)
Loading the math board and drawing, please wait…
In collections
Candy Bars
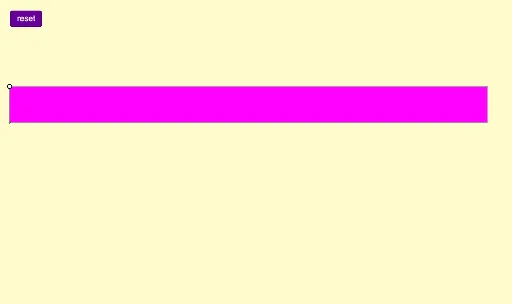
This example demonstrates the measurement of a candy bar, involving concepts of fractions, ratios, and cylinders. Using GeoGebra commands such as Polygon, Text, and Custom, an intuitive geometric model is constructed. Suitable for middle and high school students to learn about geometry and ratio concepts.
GeoGebra Commands & Parameters
Polygon(A, B, C, D) → poly1, a, b, c, dText("\frac{1}{12}", Centroid[poly1] + (-8, 0.75), true, true) → text1Custom(K) → q3, n, h_1, i_1, j_1, k_1, l_1, m_1, L, M, N, O, p, P, Q, R, S, T, U, V, q, r, s, t, e, f_1, g_1
AI Drawing Prompt Reference
Draw a graphic representing candy bar measurement. The graphic includes a cylinder representing the shape of the candy bar. Next, place a rectangle to represent the measurement area. Add a fraction 1/12 on the rectangle to indicate partial measurement. The graphic should intuitively show the relationship between the cylinder and the rectangle, and how to understand measurement concepts through fractions. The construction order is to draw the cylinder first, then the rectangle, and finally add the fraction label.
The prompt above was compiled from the original drawing commands and is for reference only.