
Boxplot Visualization
Loading the math board and drawing, please wait…
In collections
Selected Examples
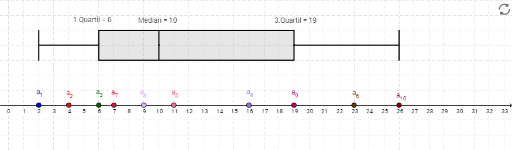
① This example demonstrates how to construct a boxplot in GeoGebra, visually summarizing the five-number summary (minimum, first quartile Q1, median, third quartile Q3, maximum) of a dataset. ② The core mathematical concepts involve descriptive statistics, quartiles, median, and the construction of box-and-whisker plots, along with data sorting and element extraction. ③ Construction highlights: from the construction summary, commands such as Ray, Point, Sort, Element, and BoxPlot are used, with objects Q1, Q3, and Median defined; lists Liste1 and Liste2 store the data, and auxiliary points (A, B, C, etc.) and rays help build the coordinate axes and data points, ultimately generating the boxplot. ④ This is suitable for middle school statistics lessons, high school math classes, or introductory college statistics courses, aiding in understanding data distribution and outlier detection.
GeoGebra Commands & Parameters
Ray((0, 1), (1, 1)) → cPoint(xAxis) → APoint(xAxis) → BPoint(xAxis) → CPoint(xAxis) → DPoint(xAxis) → EPoint(xAxis) → FPoint(xAxis) → GPoint(xAxis) → HPoint(xAxis) → IPoint(xAxis) → JSort(Liste1) → Liste2Element(Liste2, 1) → B3Element(Liste2, 2) → C3Element(Liste2, 3) → D3Element(Liste2, 4) → E3Element(Liste2, 6) → G3Element(Liste2, 7) → H3Element(Liste2, 8) → I3Element(Liste2, 9) → J3Element(Liste2, 10) → K3Element(Liste2, 5) → F3BoxPlot(4, 1, Liste1) → dQ1(Liste1) → qu1Q3(Liste1) → qu3Median(Liste1) → med
AI Drawing Prompt Reference
Draw a boxplot that summarizes a dataset's five-number summary. Start with a horizontal ray as a baseline on the coordinate plane. Place ten data points along the x-axis. Sort these points in ascending order and extract the minimum, first quartile, median, third quartile, and maximum. Above the baseline, construct a box spanning from the first to the third quartile, with a line inside marking the median. Extend whiskers from the box ends to the minimum and maximum values. The final plot clearly shows the data's spread, center, and variability.
The prompt above was compiled from the original drawing commands and is for reference only.