
Box Office Data Analysis
Loading the math board and drawing, please wait…
In collections
About Exponents
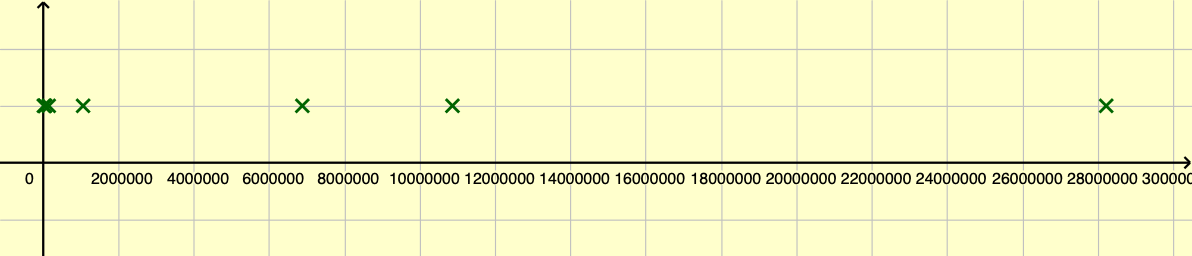
This example demonstrates the distribution and trends of movie box office data through a dot plot. Core mathematical concepts include probability & statistics, variance analysis, and geometric figures like cuboids and polygons. The construction summary uses the DotPlot command to create scatter plots, involving objects A1-B8 and lists 1, 2. Suitable for high school and above mathematics education, focusing on probability statistics and data analysis.
GeoGebra Commands & Parameters
DotPlot(list1) → list2
AI Drawing Prompt Reference
Create a scatter plot to show the distribution and trends of movie box office data. Use the data points from list1 and apply the DotPlot command to generate a series of points representing different movie box office revenues, to observe the distribution of the data.
The prompt above was compiled from the original drawing commands and is for reference only.