
Book Graph y-int Integer Slope
Loading the math board and drawing, please wait…
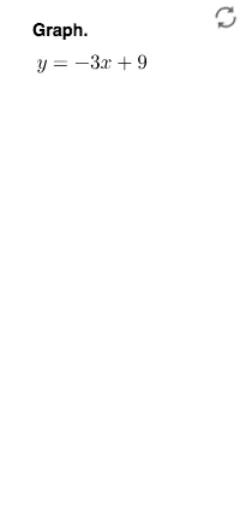
This example demonstrates how to graph functions with integer y-intercepts and slopes. It involves core math concepts like function graphs, centroids, variance, intersections, fractal geometry, and exponential functions. Construction highlights the use of GeoGebra commands like Element, Line and objects such as lm, pm, m, lb, pb, b, text1, f, text2, A, B, g, ans, text3. Suitable for high school mathematics education and in-depth study of function graphs.
GeoGebra Commands & Parameters
Element(lm, pm) → mElement(lb, pb) → bLine(A, B) → g
AI Drawing Prompt Reference
Draw a function graph showing integer y-intercepts and slopes, involving core math concepts like function graphs, centroids, variance, intersections, and fractal geometry. First, draw a line connecting two points, then two helper line segments, and finally label key points and add text annotations.
The prompt above was compiled from the original drawing commands and is for reference only.