
Point-Slope Form: Visualizing Linear Functions
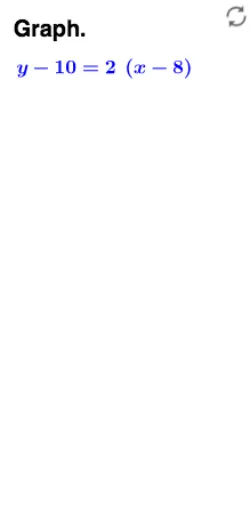
Loading the math board and drawing, please wait…
This example demonstrates how to graph the point-slope form equation y-y₁=m(x-x₁). Core mathematical concepts include linear function representation, the geometric meaning of slope (Δy/Δx), and converting between point-slope and slope-intercept forms. Construction details: Use the Line command to draw a line passing through point A(x₁,y₁) with slope m; employ Slider controls to dynamically adjust the slope value and observe how the line's angle changes; define function f(x)=m(x-x₁)+y₁ using the Function command and plot its graph; display the equation text. This example is suitable for middle and high school mathematics teaching, helping students intuitively understand the relationship between linear function graphs and parameters, and master writing function expressions using the point-slope form.
GeoGebra Commands & Parameters
Remove(Sequence[-10, 10], {0}) → lpElement(lp, s2) → x1Element(Remove[lp, {x1, (-x1)}], s3) → y1Element(lm, s1) → mLine(A, B) → g
AI Drawing Prompt Reference
Plot a straight line in the coordinate plane that passes through a fixed point with coordinates (x₁, y₁), where x₁ and y₁ are values selected from a predefined sequence. Create an adjustable slider to change the slope m of the line, and observe how the line's angle changes as the slope value is modified. Define a linear function based on the point-slope form equation y-y₁=m(x-x-x₁) and graph its curve in the coordinate system while displaying the corresponding equation text on the figure.
The prompt above was compiled from the original drawing commands and is for reference only.