
Book Graph with Standard Form Integer Intercepts
Loading the math board and drawing, please wait…
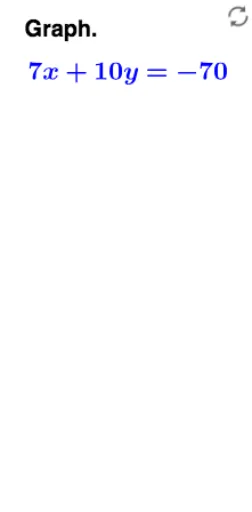
This example demonstrates the graphical representation of linear equations in standard form with integer intercepts. It involves concepts of coordinate geometry and function graphing. Using GeoGebra commands such as Line, Remove, and Element, the construction of linear equations with integer intercepts is illustrated. Suitable for middle and high school students learning linear equations and coordinate geometry.
GeoGebra Commands & Parameters
Line(A, B) → gRemove(Sequence[-10, 10], {0}) → laElement(la, sa) → aRemove(Sequence[-10, 10], {0, a, (-a)}) → lbElement(lb, sb) → b
AI Drawing Prompt Reference
Draw a coordinate plane with a straight line passing through two integer intercept points on the axes. From the integer scale from -10 to 10, exclude 0, then randomly pick one integer as the x-intercept. Then exclude that integer and its opposite, and randomly pick another integer as the y-intercept. Finally, show the line connecting these two intercept points, with integer tick marks visible on both axes.
The prompt above was compiled from the original drawing commands and is for reference only.