
Binomial Distribution Graph
Loading the math board and drawing, please wait…
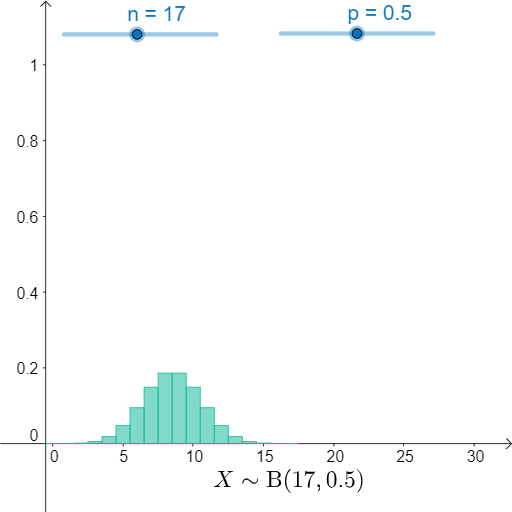
This example demonstrates the probability mass function graph of a binomial distribution. Key math concepts include probability & statistics, binomial distribution, and function graphing. It is constructed using the GeoGebra command BinomialDist, involving objects n (trials), p (success probability), a (distribution range), and text1 (text label). Suitable for high school and above students to understand the properties of binomial distribution in probability statistics.
GeoGebra Commands & Parameters
BinomialDist(n, p) → a
AI Drawing Prompt Reference
Plot the probability mass function graph of a binomial distribution with n trials and a success probability of p. First, set the values of n and p, then generate the binomial distribution probability mass function graph using these values.
The prompt above was compiled from the original drawing commands and is for reference only.