
Binomial Distribution Demo by Scott Farrar
Loading the math board and drawing, please wait…
In collections
Statistical Intuition Builders
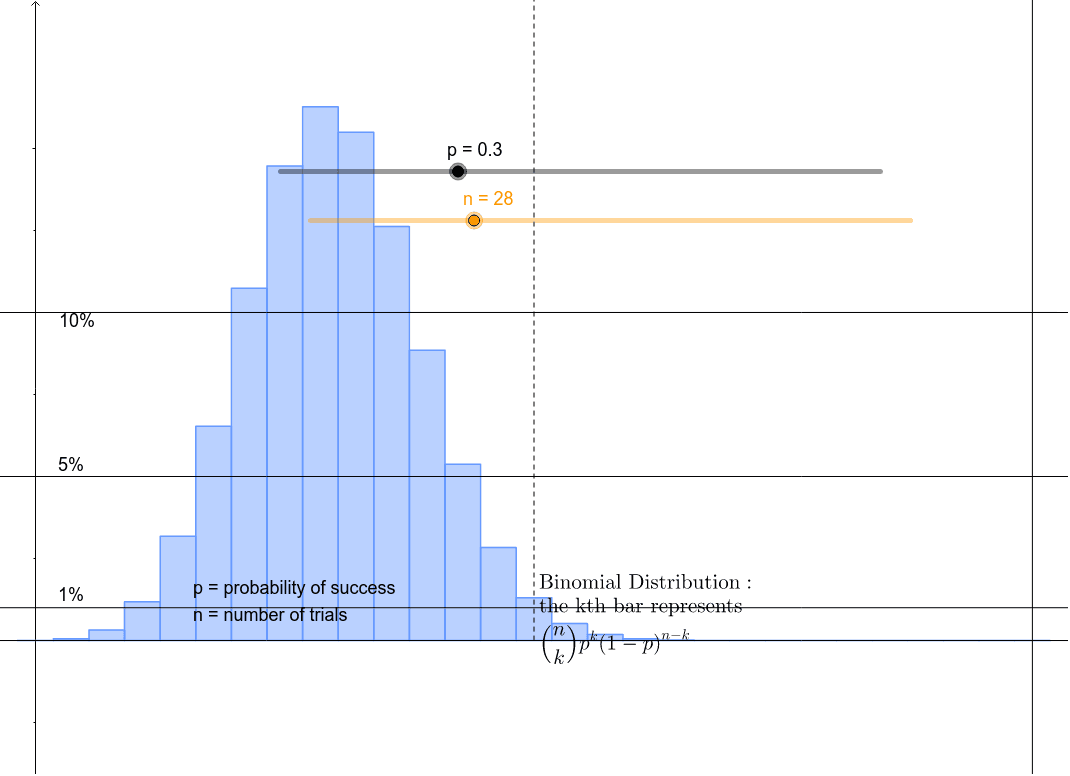
This example demonstrates the binomial distribution graphically, showing the probability of getting exactly k successes out of n trials. Core math concepts include binomial formula, probability calculation, and combinations. Constructed using GeoGebra commands: nPr for combinations, BinomialDist for the distribution, and Ray for rays. Suitable for high school and above students learning discrete probability distributions.
GeoGebra Commands & Parameters
nPr(n, c) → lBinomialDist(n, p) → aRay(A, (x(A), 1)) → k
AI Drawing Prompt Reference
Create a graph of the binomial distribution to show the probability of getting exactly k successes in n trials. First, calculate the combinations using nPr(n, c), then plot the distribution curve with the BinomialDist(n, p) formula. Finally, draw a ray from the point (n, 0) on the x-axis to (0, 1) to represent a probability value of 1.
The prompt above was compiled from the original drawing commands and is for reference only.