
Binomial Distribution - Cumulative Distribution
Loading the math board and drawing, please wait…
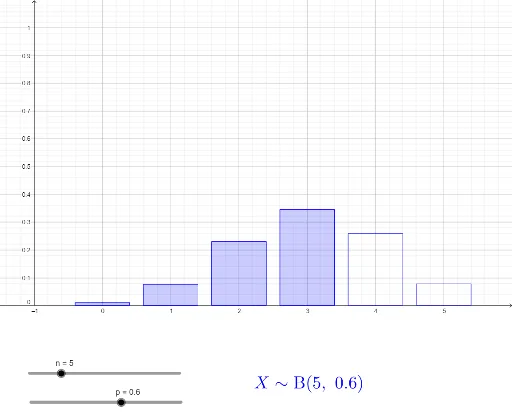
This example demonstrates the cumulative distribution of a binomial distribution. It involves key mathematical concepts such as binomial probability. Using GeoGebra commands Sequence and BarChart, you can dynamically adjust parameters n and p to observe changes in the cumulative distribution. Suitable for high school mathematics education and students learning probability and statistics.
GeoGebra Commands & Parameters
Sequence(0, n) → thexsSequence(BinomialDist[n, p, k, false], k, 0, n) → thefreqsBarChart(thexs, thefreqs, 0.8) → thedistBarChart(Sequence[0, 3], Sequence[BinomialDist[n, p, k, false], k, 0, 3], 0.8) → a
AI Drawing Prompt Reference
Create a bar chart to visualize the cumulative distribution of a binomial distribution with adjustable parameters n and p, showing the cumulative probabilities from 0 to n, and include a detailed bar chart from 0 to 3 for close-up observation, suitable for learning probability and statistics.
The prompt above was compiled from the original drawing commands and is for reference only.