
Binomial Distribution and Normal Approximation
Loading the math board and drawing, please wait…
In collections
Statistics Demonstrations
Statistics Demonstrations
Statistics Demonstrations
Statistics Demonstrations
Statistics Demonstrations
Statistical Applets
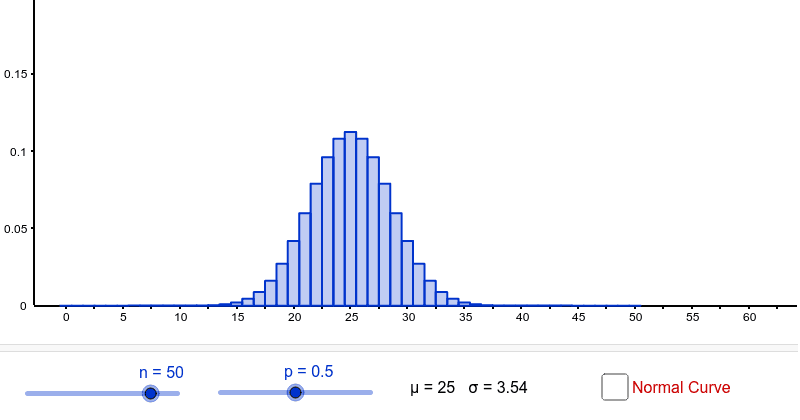
This example visually demonstrates the binomial distribution and its normal approximation. It allows users to adjust parameters n and p to observe the probability mass function of the binomial distribution and shows the process of normal approximation through slider animation. Key mathematical concepts include binomial distribution, probability & statistics, and normal distribution. GeoGebra commands BinomialDist, Normal are used to construct the graph. Suitable for high school mathematics education and learning probability & statistics.
GeoGebra Commands & Parameters
BinomialDist(n, p) → aNormal(mean, sd, x) → f
AI Drawing Prompt Reference
Create a chart demonstrating the binomial distribution and its normal approximation. Include a binomial probability mass function with adjustable parameters n and p, and an animated normal approximation shown via a slider. The graph should clearly contrast the two distributions and label key mathematical concepts: binomial distribution, probability & statistics, and normal distribution.
The prompt above was compiled from the original drawing commands and is for reference only.