
Bengal Season Data Simulation: BoxPlot and DotPlot Visualization
Loading the math board and drawing, please wait…
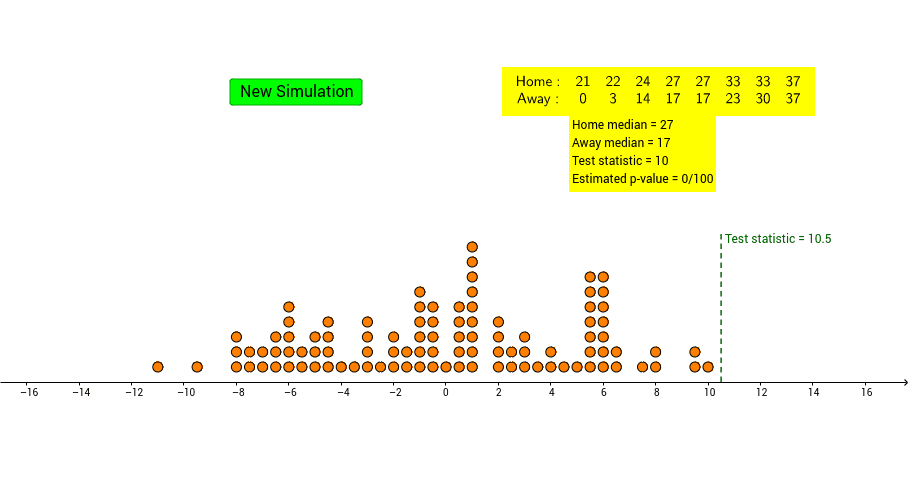
This example demonstrates how to use GeoGebra to simulate and visualize seasonal data distributions. It uses BoxPlot and DotPlot to display data distribution characteristics, combined with commands like Shuffle for random permutation, Take for element extraction, and CountIf for conditional counting. Core mathematical concepts include geometric mean, correlation analysis, and piecewise functions. Construction key points: Use BoxPlot command to draw box plots showing data distribution, use DotPlot to present specific values, use TableText to display data in tabular form, and use Segment to draw key line segments. Suitable for high school and above students for statistical learning, demonstrating data visualization methods, understanding statistical chart meanings, and practicing data processing commands.
GeoGebra Commands & Parameters
BoxPlot(1, 0.5, away, true) → aBoxPlot(3, 0.5, home, true) → bShuffle(Join[{home, away}]) → list1Take(list1, 1, 8) → newhomeTake(list1, 9, 16) → newawayCountIf(x > -100, data) → eCountIf(x ≥ c, data) → fJoin({{"Home:"}, Sort[newhome]}) → list3Join({{"Away:"}, Sort[newaway]}) → list4TableText({list3, list4}, "c") → text1Segment((c, 0), (c, 3)) → gDotPlot(data, false, 0.3) → list2
AI Drawing Prompt Reference
Create a visualization of baseball season data using box plots and dot plots. First, draw box plots to show the data distribution, then use dot plots to present specific values. Shuffle the data and take the first 8 and the next 8 as home and away team performances, respectively. Count the number of data points greater than -100 and greater than or equal to a value c. Sort and display the home and away team data in tables. Finally, draw a vertical line to indicate a value c.
The prompt above was compiled from the original drawing commands and is for reference only.