
Basic Statistics with TI 83/84 Calculator
Loading the math board and drawing, please wait…
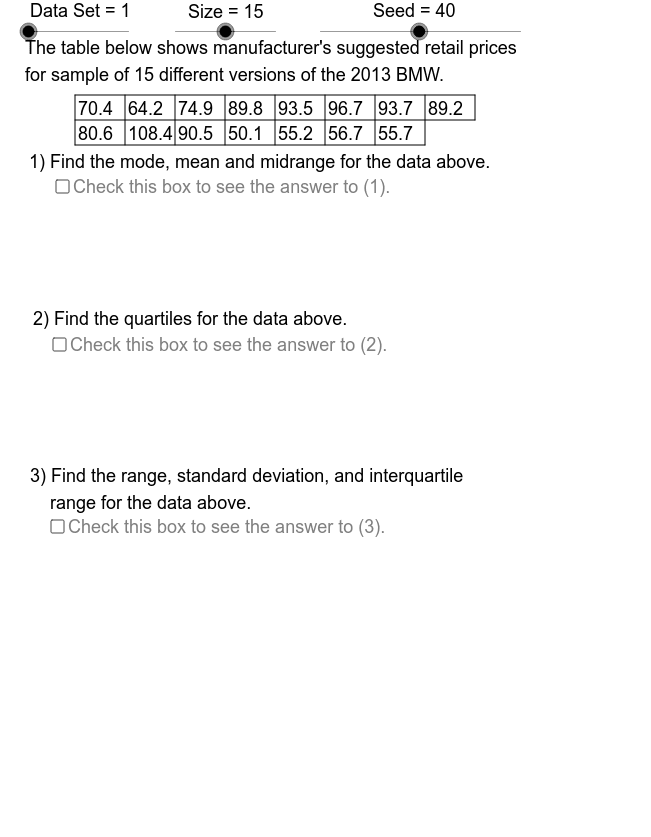
This example demonstrates how to use the TI 83/84 calculator to calculate basic statistics such as mean, median, quartiles, and standard deviation. By understanding the GeoGebra commands in the construction summary, one can learn how to process data and perform statistical analysis. Suitable for high school math and statistics courses.
GeoGebra Commands & Parameters
Element(RtSq, Mod[Seed, 8] + 1) → RateSequence(Mod[Strt + (Rate * k), 23] + 1, k, 0, 22, 1) → OpSqElement(DSSq, DataSet) → DS0Element(AcSq, DataSet) → Ac1Sequence(Element[DS0, Element[OpSq, k]], k, 1, Size) → SmpMax(Smp) → SmpMxMin(Smp) → SmpMnSequence(k, k, 1, 19) → StrSqSequence(Element[Smp, k], k, LngRw1 + 1, Size) → SmpRw2Sequence(Element[Smp, k], k, 1, LngRw1) → SmpRw1Element(DDSq, DataSet) → DD0CountIf(x > 0, RtSq) → RtNoSegment(TbML, TbMR) → tbmdSegment(TbLL, TbLR) → tbbtSegment(TbUL, TbUR) → tbtpCountIf(x ≠ (0, 0), DS0) → DtCntIf(Mod[Size, 2] ≟ 1, Segment[TbMR, TbUR], Segment[TbLR, TbUR]) → tbrgSort(Smp) → SmpOrdSequence(k, k, 12, 18, 1) → SzSqSequence(Segment[(TbLf + (TbCW * k), TbTp), (TbLf + (TbCW * k), TbBt)], k, 0, floor(Size / 2)) → TbVLSequence((Element[Smp, k] - SmpAvg)^(2), k, 1, Size) → SmpDvSqSqSum(Smp) → SmpSmQ1(Smp) → SmpQ1Q3(Smp) → SmpQ3Median(Smp) → SmpQ2If(Ac2 ≟ 1, ".", "s.") → PlTxtMode(Smp) → SmpModSequence(TbTp - (1.1 * k), k, 0, 2) → TbLHSqIf(SmpMn < 0, "(", "") → NgLfMnIf(SmpMn < 0, ")", "") → NgRtMnIf(SmpQ1 < 0, "(", "") → NgLfQ1If(SmpQ1 < 0, ")", "") → NgRtQ1Sequence(Text[Element[SmpRw2, k], (TbLf - 0.95 + (k * TbCW), TbTp - 0.4 - TbRH)], k, 1, LngRw2) → SmpRw2TxSequence(Text[Element[SmpRw1, k], (TbLf - 0.95 + (k * TbCW), TbTp - 0.4)], k, 1, LngRw1) → SmpRw1Tx
AI Drawing Prompt Reference
Create a statistical chart that includes the dataset and its statistical measures such as maximum, minimum, median, quartiles, mean, standard deviation, and mode. Start by creating the dataset, then calculate and mark the maximum, minimum, median, and quartiles, followed by the standard deviation and mode, and finally display these measures on the chart.
The prompt above was compiled from the original drawing commands and is for reference only.