
Barber Calls Simulation
Loading the math board and drawing, please wait…
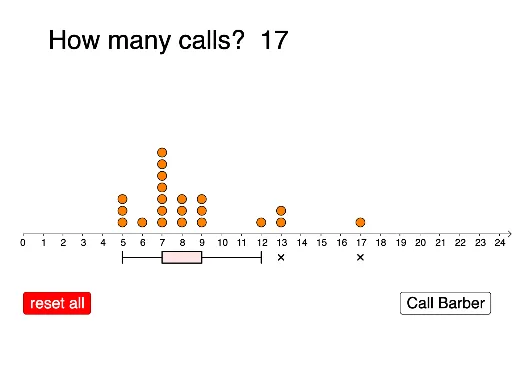
This example demonstrates the statistical characteristics of random customer calls at a barber shop, involving concepts like Random Experiments, Random Variables, Statistical Characteristics, Statistics, Stochastic Processes, Correlation, Interest Calculation, Median Line, and Derivative. It uses commands such as Sample, Sort, Unique, DotPlot, and BoxPlot in GeoGebra for construction. Suitable for high school and above in probability & statistics and stochastic processes education.
GeoGebra Commands & Parameters
Sample(barbers, 1, true) → l1Sort(data) → l2Unique(l2) → l3DotPlot(C, false) → l4BoxPlot(-2, 0.5, C, true) → cBoxPlot(-2, 0.5, C, true) → d
AI Drawing Prompt Reference
Simulate random customer arrivals at a barber shop to display statistical characteristics. Start by sampling from a customer set, sorting, and extracting unique values, then visualize the data using dot plots and box plots to reveal distribution and statistical properties, suitable for high school probability, statistics, and stochastic processes education.
The prompt above was compiled from the original drawing commands and is for reference only.