
GeoGebra Practice: Exploring a New Kind of Number
Loading the math board and drawing, please wait…
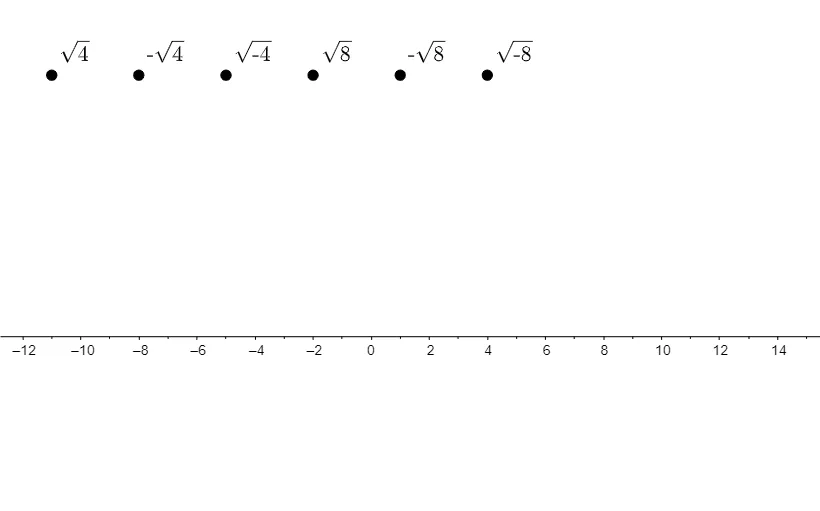
This GeoGebra example demonstrates how a “new kind of number” idea can be converted into geometric quantities and visualized through constructions, then examined using computation. It integrates core concepts from calculus (function behavior and derivative-based reasoning), geometry (notably isosceles triangle relationships and measurements), and statistics-style interpretation of computed values. Construction approach: starting from the key points labeled A, B, C, D, E, F, the model builds a geometric configuration (using connections and constraints to realize an isosceles triangle structure), derives numerical measures from the configuration, and links these measures to functions/graphs and derivative-related analysis to reveal how the “new number” changes with parameters. The resulting quantities can also be used to motivate statistical viewpoints. Suitable for advanced secondary students and early undergraduate learners for demonstration, modeling, and exploratory learning.
GeoGebra Commands & Parameters
(-11, 9)(-8, 9)(-5, 9)(-2, 9)(1, 9)(4, 9)
AI Drawing Prompt Reference
Plot six points in a coordinate plane with the same y-value of 9, and x-values −11, −8, −5, −2, 1, and 4. Connect the points in order to form a polyline or piecewise line, keeping the connections clearly visible. Then focus on how geometric quantities derived from the connected segments—such as segment lengths or slopes between adjacent points—can be interpreted as values that change with a parameter. Relate these changing measurements to derivative-style reasoning about how the “new number” evolves, leaving the construction suitable for later computation and statistical-style interpretation.
The prompt above was compiled from the original drawing commands and is for reference only.