
Bar Graph and Statistical Demonstration
Loading the math board and drawing, please wait…
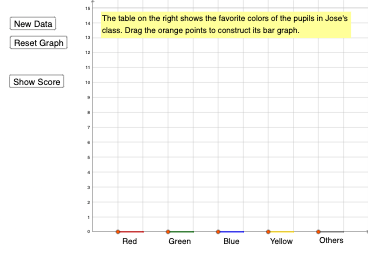
This example demonstrates bar graphs and their application in statistics, including standard deviation, median line, and confidence interval. Key math concepts involve bar chart construction, standard deviation calculation, median line, confidence interval, root, and straight line equations. Construction highlights include using GeoGebra commands like Random for data generation, Point for plotting points, Segment for lines, Polygon for shapes, and If for conditional color display, with objects like red, blue, yellow, green, and A, B, C, etc. It is suitable for high school statistics and probability education, visualizing data distribution and statistical inference.
GeoGebra Commands & Parameters
Random(1, 12) → red, 7Random(1, 12) → blue, 9Random(1, 12) → yellow, 4Random(1, 12) → green, 1Random(1, 12) → others, 7Point(xAxis) → APoint(xAxis) → BPoint(xAxis) → CPoint(xAxis) → ESegment(F, A) → fSegment(G, B) → gSegment(H, C) → hSegment(I, D) → iSegment(J, E) → jPoint(f) → KPoint(g) → LPoint(h) → MPoint(i) → NPoint(j) → OPoint(xAxis) → PPoint(xAxis) → QPoint(xAxis) → RPoint(xAxis) → SPoint(xAxis) → TPolygon(K, A, P, U) → q1, k, a, p, uPolygon(L, B, Q, V) → q2, l, b, q, vPolygon(M, C, R, W) → q3, m, c, r, wPolygon(N, D, S, Z) → q4, n, d, s, z_1Polygon(O, E, T, A_1) → q5, o, e, t, a_1If(q2 ≟ green, 1, 0) → s2If(q1 ≟ red, 1, 0) → s1If(q3 ≟ blue, 1, 0) → s3If(q4 ≟ yellow, 1, 0) → s4If(others ≟ q5, 1, 0) → s5
AI Drawing Prompt Reference
Create a bar graph to show the distribution of different colors. First, generate 5 sets of random data: 7 red, 9 blue, 4 yellow, 1 green, and 7 others. Then mark points A, B, C, and E on the x-axis. Draw line segments f, g, h, i, and j connecting these points. Next, use these segments as bases to draw bar graphs q1, q2, q3, q4, and q5 in red, blue, yellow, green, and other colors, respectively. Finally, use conditional statements to set the values of s1, s2, s3, s4, and s5 based on the color of the bars.
The prompt above was compiled from the original drawing commands and is for reference only.