
Bank Queue Time Linear Regression Analysis
Loading the math board and drawing, please wait…
In collections
UCSS Secondary Math I Unit 4 Lesson 3
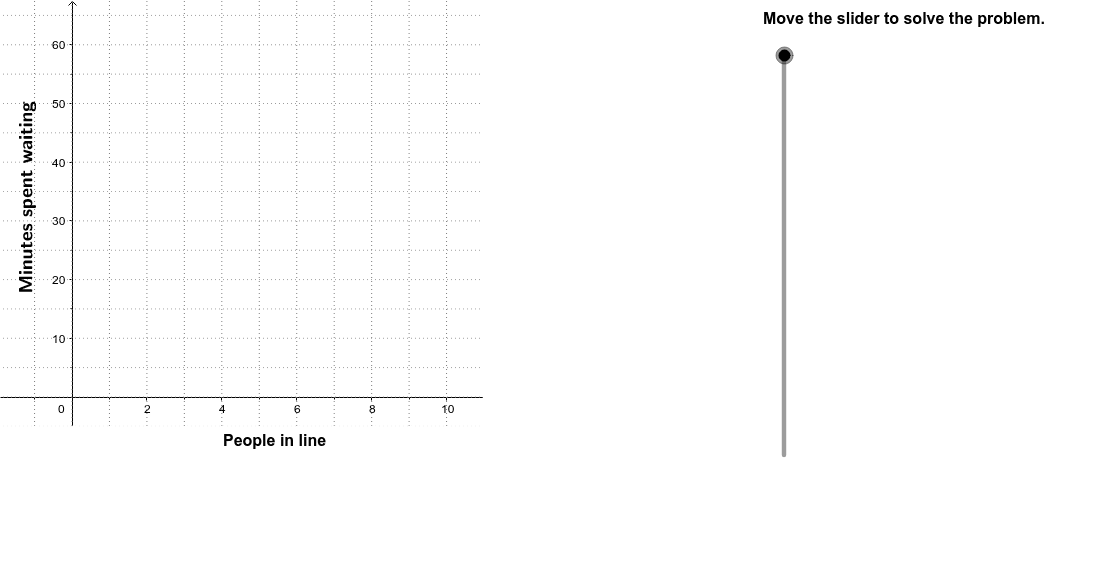
This example demonstrates linear regression analysis of the relationship between customer wait time and queue length in a bank system. Key math concepts include linear regression, line segments, logic, and geometric distribution. GeoGebra commands and objects used in construction are Polygon, Textfield, Line, Sequence, Segment, and RotateText. Suitable for high school mathematics education, helping students understand data visualization and statistical modeling.
GeoGebra Commands & Parameters
Polygon((11, y(Corner[2])), Corner[2], Corner[3], (11, y(Corner[4]))) → poly1, a, c, d, eTextfield(A1) → InA1Textfield(A2) → InA2Textfield(A3) → InA3Textfield(A4) → InA4Textfield(A5) → InA5Textfield(B1) → InB1Textfield(B2) → InB2Textfield(B3) → InB3Textfield(B4) → InB4Textfield(B5) → InB5Line(P_1, P_2) → gTextfield(A6) → InA6Textfield(A7) → InA7Textfield(B6) → InB6Textfield(B7) → InB7Sequence(Segment[(13.5, 13 + (6 * i)), (18, 13 + (6 * i))], i, 0, 7) → LinesHorSegment((13.5, 66), (18, 66)) → TopSegment((13.5, 13), (13.5, 66)) → Side1Segment((18, 13), (18, 66)) → Side2Segment((15.75, 13), (15.75, 66)) → MidLineSequence(x = i, i, -2, 11) → Hash1Sequence(y = (5 * i), i, -2, 13) → Hash2RotateText("Minutes spent waiting", 90*°) → SideLegand2Polygon((11, -5), (-2, -5), Corner[1], (11, y(Corner[1]))) → poly2, f, h, i, j
AI Drawing Prompt Reference
Create a graph demonstrating linear regression analysis of customer wait time versus queue length in a bank. Include a polygon for the bank area, multiple text fields for data display, a line segment for linear regression, and horizontal and vertical guide lines. Add coordinate axis ticks and a rotated text label on the left side. Construct the graph by first drawing the bank area, then adding data and guide lines, and finally labeling with text.
The prompt above was compiled from the original drawing commands and is for reference only.