
Arithmetic Sequence Graph and General Term
Loading the math board and drawing, please wait…
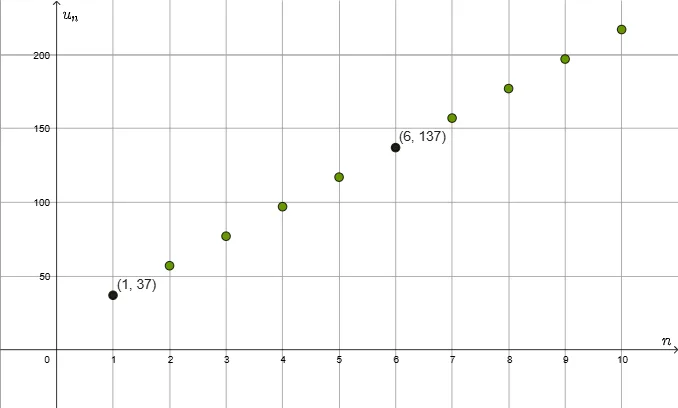
This example demonstrates the graph of an arithmetic sequence and its general term formula. Key math concepts include arithmetic sequences, general term, graph plotting, slope, and difference. GeoGebra commands like Random, RandomElement, Simplify, Corner, Textfield, If, and Sequence are used in construction. Suitable for high school mathematics teaching to understand the graphical representation and formula derivation of arithmetic sequences.
GeoGebra Commands & Parameters
Random(-20, 20) → bBRandomElement(aAlist) → aASimplify((aA * n) + bB) → uURandom(1, 5) → qn1Corner(5) → dimsTextfield(stans) → InputBox1Random(1, 2) → qQIf(bB ≟ 0, "", If[bB > 0, bBpos, bBneg]) → bBtextSequence((n, uU(n)), n, 1, 10) → l1If(aA ≟ 1, "", If[aA ≟ -1, "-"]) → aatextIf(aA ≟ 1, "", If[aA ≟ -1, "-", aAtextne1]) → aAtext
AI Drawing Prompt Reference
Draw a scatter plot of an arithmetic sequence with terms indexed from 1 to 10 on the x-axis and their values on the y-axis. The first term and common difference are random integers, but ensure the graph is clear. Plot points for each term and connect them with a straight line to show the linear trend. Next to the graph, display the general term formula in the form 'a_n = first term + (n-1)*difference', using specific numbers or symbols. Simplify the formula if the first term or difference is 0 or 1. Also include an input box on the graph for user interaction, allowing entry of a value to verify or modify sequence parameters. The overall layout should include coordinate axes, grid lines, sequence points, trend line, formula text, and input box, suitable for high school math teaching.
The prompt above was compiled from the original drawing commands and is for reference only.