
Arithmetic Mean of Discrete Data
Loading the math board and drawing, please wait…
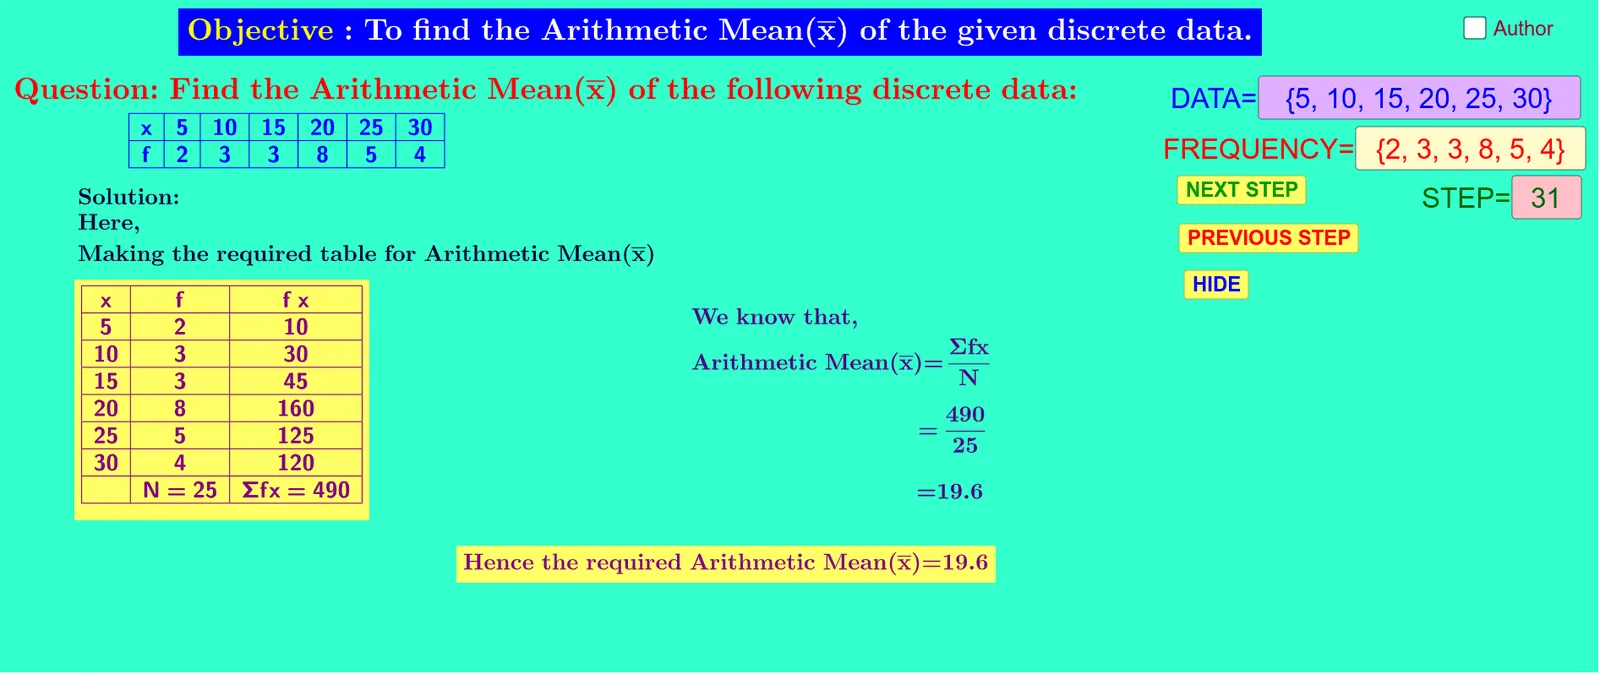
This example demonstrates how to calculate the arithmetic mean of discrete data. The core mathematical concept involved is the arithmetic mean. Using GeoGebra commands such as Textfield, Element, TableText, Sum, and If, a dynamic geometric figure that includes data input boxes, mean calculation, and result display can be constructed. Suitable for students at the junior high school level and above to learn the concept and application of arithmetic mean.
GeoGebra Commands & Parameters
Textfield(data) → InputBox1Textfield(f) → InputBox2Element(data, 2) → A54Element(data, 3) → A55Element(data, 4) → A56Element(data, 5) → A57Element(data, 6) → A58Element(f, 1) → B53Element(f, 2) → B54Element(f, 3) → B55Element(data, 1) → A2Element(data, 2) → A3Element(data, 3) → A4Element(data, 4) → A5Element(data, 5) → A6Element(data, 6) → A7Element(f, 1) → B2Element(f, 2) → B3Element(f, 3) → B4Element(f, 4) → B5Element(f, 5) → B6Element(f, 6) → B7TableText({{A1, A2, A3, A4, A5, A6, A7}, {B1, B2, B3, B4, B5, B6, B7}}, "|_ccccccc") → text1TableText({{A1, B1, C1}, {A2, B2, C2}, {A3, B3, C3}, {A4, B4, C4}, {A5, B5, C5}, {A6, B6, C6}, {A7, B7, C7}, {A8, B8, C8}}, "|_ccc") → text2Sum(B2:B7) → B10Sum(C2:C7) → C10If(w > 3, ("" * A1), "") → A12If(w > 4, ("" * B1), "") → B12If(w > 5, ("" * A2), "") → A13If(w > 6, ("" * B2), "") → B13If(w > 7, ("" * A3), "") → A14If(w > 8, ("" * B3), "") → B14If(w > 9, ("" * A4), "") → A15If(w > 10, ("" * B4), "") → B15If(w > 11, ("" * A5), "") → A16If(w > 12, ("" * B5), "") → B16If(w > 13, ("" * A6), "") → A17If(w > 14, ("" * B6), "") → B17If(w > 15, ("" * A7), "") → A18If(w > 16, ("" * B7), "") → B18If(w > 17, ("" * C1), "") → C12If(w > 18, ("" * C2), "") → C13If(w > 19, ("" * C3), "") → C14If(w > 20, ("" * C4), "") → C15If(w > 21, ("" * C5), "") → C16If(w > 22, ("" * C6), "") → C17If(w > 23, ("" * C7), "") → C18If(w > 24, ("" * B8), "") → B19If(w > 25, ("" * C8), "") → C19TableText({{A12, B12, C12}, {A13, B13, C13}, {A14, B14, C14}, {A15, B15, C15}, {A16, B16, C16}, {A17, B17, C17}, {A18, B18, C18}, {A19, B19, C19}}, "|_ccc") → text5Textfield(w) → InputBox3
AI Drawing Prompt Reference
Create a coordinate-style layout with two editable input fields: one for a discrete data sequence and one for a corresponding sequence of coefficients/values. Plot or place discrete points for the data entries (items 1 through 6) and similarly for the coefficient sequence entries in matching positions. Add a table area that shows the combined entries by index: present the paired values in a first row-like block, then include additional cells that reflect cumulative sums derived from the coefficient and data columns. Include conditional text cells in the table that appear in different positions depending on the current index value, so the filled entries change as the index increases.
The prompt above was compiled from the original drawing commands and is for reference only.