
Areas with Polar Coordinates: Interactive Calculus Exploration
Loading the math board and drawing, please wait…
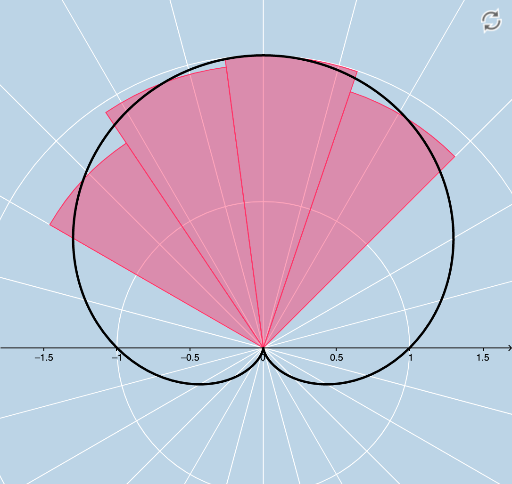
① This interactive GeoGebra applet demonstrates how to compute the area bounded by a single polar function and two rays, providing a visual and dynamic learning environment. ② Core mathematical concepts include polar coordinates, definite integrals, Riemann sums (upper and lower), sector approximations, and the limit process, clarifying the area element in polar form. ③ Construction highlights: uses CurveCartesian to plot the polar curve, Sequence to generate partition points and sectors, Sum to compute Riemann sums, and Textfield/InputBox for interactive parameters (r, a, tmin, tmax, n). Objects like UPPERS, LOWERS, SECTORS, and centers enable dynamic visualization of the approximation as n changes. ④ Suitable for university calculus or advanced high school mathematics, ideal for classroom demonstrations or self-study to grasp the derivation of the polar area formula.
GeoGebra Commands & Parameters
CurveCartesian((r(t) * cos(t)), (r(t) * sin(t)), t, 0, 6.283185307179586) → aSequence(a(i), i, tmin, tmax, b) → list1Sequence(Segment[(0, 0), Element[list1, i]], i, 0, n) → list2Sequence(Polygon[(0, 0), Element[list1, i], Element[list1, i + 1]], i, 1, n) → list3Textfield(tmin) → InputBox1Textfield(tmax) → InputBox2Textfield(n) → InputBox3Textfield(r) → InputBox4FractionText(tmin / π) → text2FractionText(tmax / π) → text3Sum(list3, n) → cFractionText(d) → text5Sequence(tmin + (b / 2 * i), i, 1, n, 1) → list4Sequence(tmin + (b * i), i, 0, n, 1) → ENDSSequence((0.5 * (Element[ENDS, i] + Element[ENDS, i + 1])), i, 1, n, 1) → REALCENTERSSequence(a(Element[REALCENTERS, i]), i, 1, n, 1) → centersSequence(Rotate[Element[centers, i], halftheta, A], i, 1, n, 1) → UPPERSSequence(Rotate[Element[centers, i], (-halftheta), A], i, 1, n, 1) → LOWERSSequence(Sector[Circle[A, Element[centers, i]], Element[LOWERS, i], Element[UPPERS, i]], i, 1, n, 1) → SECTORSSum(SECTORS) → e
AI Drawing Prompt Reference
Create a polar coordinate area exploration diagram: plot a polar curve defined by a user-specified function, with the origin as the pole. Within an angular interval, generate multiple sector regions by equally dividing the angle, each sector bounded by the origin, two points on the curve, and an arc, approximating the area under the curve. Display upper and lower approximating sectors, and mark the angular partition points. Include adjustable input fields for changing the function, angle range, and number of divisions, with real-time display of the total area sum. The visualization is dynamic, aiding understanding of the polar area formula derivation.
The prompt above was compiled from the original drawing commands and is for reference only.