
Areas Between Curves - dy Rectangles
Loading the math board and drawing, please wait…
In collections
Calculus - Applications of Integrals - Areas and Volumes
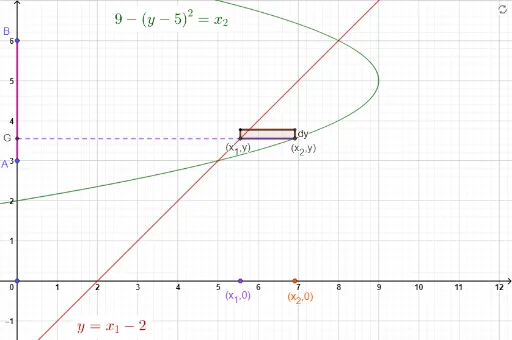
This example demonstrates how to calculate the area between two curves using the method of rectangles. It involves core math concepts like integration, function graphs, and rectangle summation. Constructed using commands such as Segment, Point, OrthogonalLine, Intersect, Line, Polygon in GeoGebra. Suitable for high school calculus students to understand the geometric meaning and numerical approximation of definite integrals.
GeoGebra Commands & Parameters
Segment(A, B) → gSegment(C, D) → hPoint(h) → POrthogonalLine(P, h) → iIntersect(f, i) → FOrthogonalLine(F, g) → jIntersect(j, g) → GIntersect(eq1, j) → H,Point(i) → ILine(I, j) → kSegment(G, F) → lSegment(F, H) → nSegment(I, F) → pOrthogonalLine(H, j) → rIntersect(k, r) → JSegment(I, J) → sSegment(J, H) → tPolygon(I, J, H, F) → q1, i_1, j_1, h_1, f_1Intersect(r, xAxis) → QSegment(E, P) → bSegment(E, Q) → c
AI Drawing Prompt Reference
Draw a diagram showing the area between two curves using vertical rectangles for approximation. Start with two function curves. Pick a point on the right curve, draw a perpendicular line from it to the left curve, then drop a perpendicular from that intersection to the left curve, forming a rectangle frame. On the perpendicular, choose another point, draw a line parallel to the left curve, and intersect it with another perpendicular to complete the rectangle. Fill this rectangle as a polygon. Mark the rectangle's height and width as segments. Finally, mark intersections on the x-axis and connect auxiliary points with segments to illustrate the summation of rectangles approximating the area.
The prompt above was compiled from the original drawing commands and is for reference only.