
Area Under a Curve and the x-axis
Loading the math board and drawing, please wait…
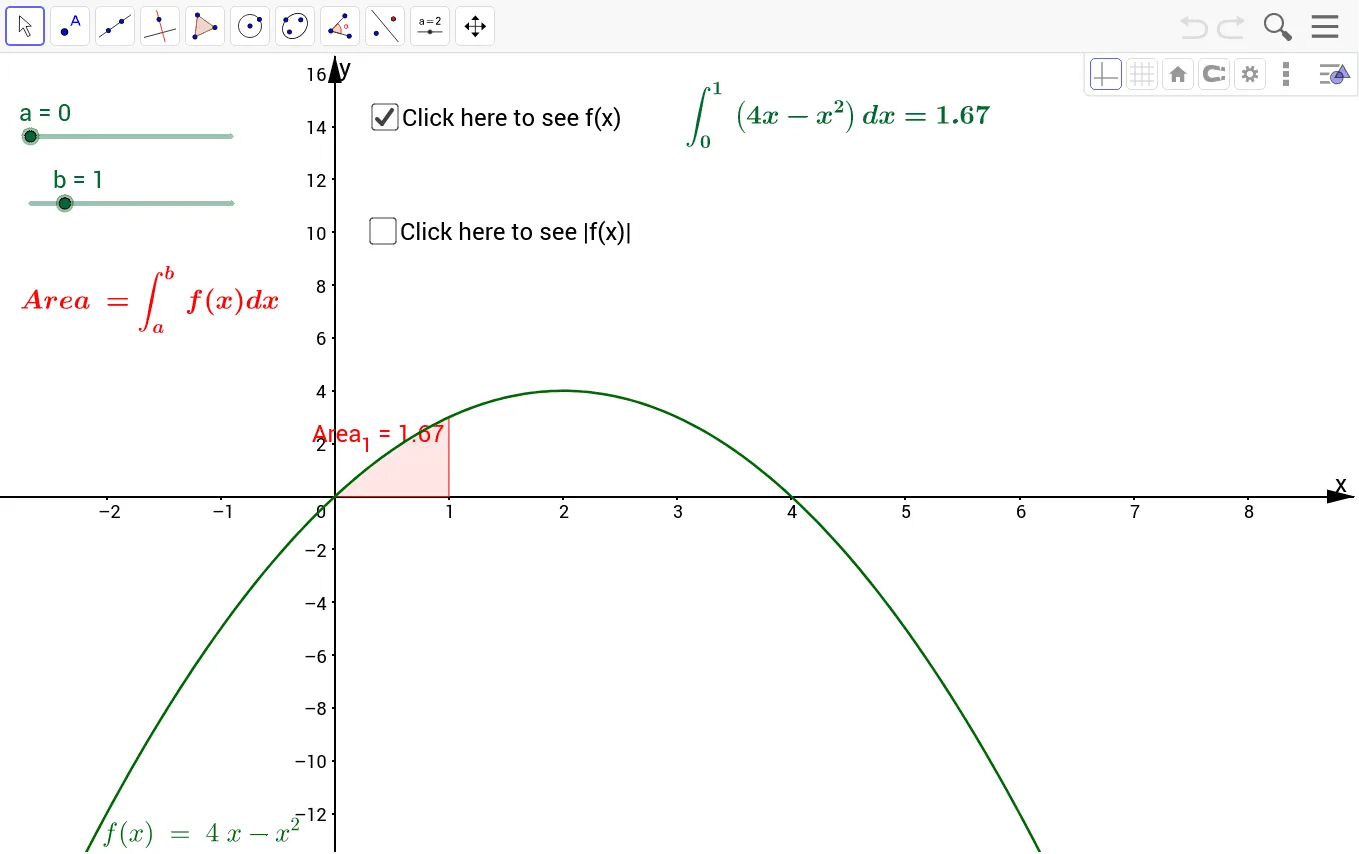
This example demonstrates how to calculate the area under a curve and the x-axis using GeoGebra. The key mathematical concept involved is integration. By using the Integral command, the area over a specified interval can be calculated. Suitable for high school mathematics education and learning.
GeoGebra Commands & Parameters
Integral(f, a, b) → Area_1Integral(g, a, b) → Area_2
AI Drawing Prompt Reference
Draw the graph of a function f(x) and the x-axis, then calculate and show the area enclosed by f(x) and the x-axis within the interval [a, b]. Next, draw the graph of another function g(x) and the x-axis, and calculate and show the area enclosed by g(x) and the x-axis within the same interval [a, b].
The prompt above was compiled from the original drawing commands and is for reference only.