
Area-Perimeter Relationship Demo
Loading the math board and drawing, please wait…
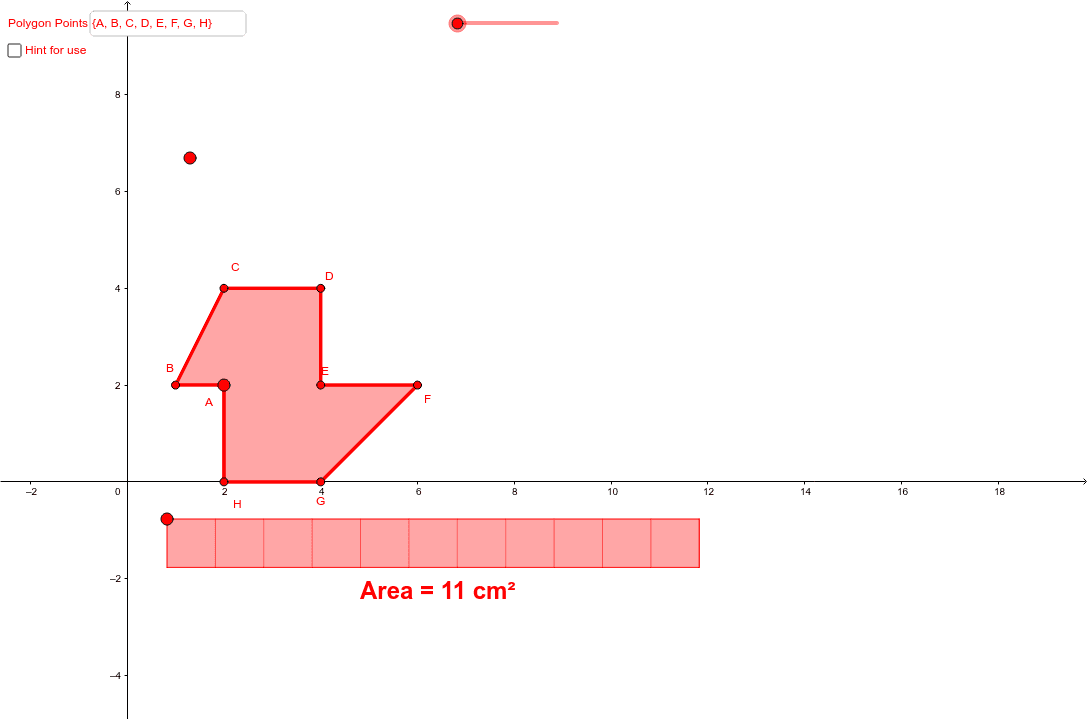
This example demonstrates the relationship and variation phenomena between the area and perimeter of polygons. It involves core mathematical concepts such as polygon construction, perimeter calculation, area calculation, function relationships, step functions, and reflection transformations. GeoGebra commands like Polygon, Length, Sequence, OrthogonalLine, Join, Midpoint, Perimeter are used to construct and measure polygons, while Textfield and Slider are utilized to display dynamic changes. It is suitable for high school mathematics teaching, helping students understand the connection between functions, geometric transformations, and optimization problems.
GeoGebra Commands & Parameters
Polygon(PolyPoints) → MyShapeTextfield(PolyPoints) → inputBox1Length(PolyPoints) → NumberOfPolygonPointsSequence(Distance[Element[PolyPoints, 1 + Mod[k - 1, NumberOfPolygonPoints]], Element[PolyPoints, 1 + Mod[k, NumberOfPolygonPoints]]], k, 1, NumberOfPolygonPoints) → DistanceBetweenPolygonPointsOrthogonalLine(PerimeterStartPoint, yAxis) → aSequence(PerimeterStartPoint + (Sum[DistanceBetweenPolygonPoints, k], 0), k, 1, NumberOfPolygonPoints) → PolygonPointsOnTheLineSequence(If[x(Element[PolyPoints, 1 + Mod[k - 1, NumberOfPolygonPoints]]) ≠ x(Element[PolyPoints, 1 + Mod[k, NumberOfPolygonPoints]]), Slope[Segment[Element[PolyPoints, 1 + Mod[k - 1, NumberOfPolygonPoints]], Element[PolyPoints, 1 + Mod[k, NumberOfPolygonPoints]]]], If[y(Element[PolyPoints, 1 + Mod[k - 1, NumberOfPolygonPoints]]) > y(Element[PolyPoints, 1 + Mod[k, NumberOfPolygonPoints]]), -1.5707963267948966, 1.5707963267948966]], k, 1, NumberOfPolygonPoints) → SlopeBetweenPolygonPointsSequence(If[x(Element[PolyPoints, 1 + Mod[k - 1, NumberOfPolygonPoints]]) ≠ x(Element[PolyPoints, 1 + Mod[k, NumberOfPolygonPoints]]), (-atan(Element[SlopeBetweenPolygonPoints, k])), If[y(Element[PolyPoints, 1 + Mod[k - 1, NumberOfPolygonPoints]]) > y(Element[PolyPoints, 1 + Mod[k, NumberOfPolygonPoints]]), 1.5708, -1.5708]], k, 1, NumberOfPolygonPoints) → AngleOfRotationOfPolygonSegmentsSequence(Segment[Element[PolyPoints, 1 + Mod[k - 1, NumberOfPolygonPoints]], Element[PolyPoints, 1 + Mod[k, NumberOfPolygonPoints]]], k, 1, NumberOfPolygonPoints) → PolygonSegmentsJoin({{PerimeterStartPoint}, PolygonPointsOnTheLine}) → AllPointsOnTheLineSequence(Vector[Element[PolyPoints, k], Element[AllPointsOnTheLine, k]], k, 1, NumberOfPolygonPoints) → TranslationVectorsSequence(Translate[Element[PolygonSegments, k], Vector[(TranslationFactor * Element[TranslationVectors, k])]], k, 1, NumberOfPolygonPoints) → TranslatePolygonSegmentsSequence(If[x(Element[PolyPoints, 1 + Mod[k - 1, NumberOfPolygonPoints]]) > x(Element[PolyPoints, 1 + Mod[k, NumberOfPolygonPoints]]), 3.141592653589793, 0], k, 1, NumberOfPolygonPoints) → AngleCorrectionFactorSequence(Rotate[Element[TranslatePolygonSegments, k], (RotationFactor * (Element[AngleOfRotationOfPolygonSegments, k] + Element[AngleCorrectionFactor, k])), Element[AllPointsOnTheLine, k]], k, 1, NumberOfPolygonPoints) → RotatePolygonSegmentsSequence(Segment[AreaStartPoint + (k, 0), AreaStartPoint + (k, -1)], k, 1, floor(MyShape)) → AreaDivisionsPolygon(AreaStartPoint, AreaStartPoint + (0, -1), AreaStartPoint + (MyShape, -1), AreaStartPoint + (MyShape, 0)) → AreaPolygon, c, d, e, fMidpoint(AreaStartPoint + (0, -1), AreaStartPoint + (MyShape, -1)) → AreaLabelMidpoint(Element[AllPointsOnTheLine, 1], Element[AllPointsOnTheLine, NumberOfPolygonPoints + 1]) → PerimeterLabelPerimeter(MyShape) → PerimeterPolygon
AI Drawing Prompt Reference
This is a geometric diagram illustrating the relationship between the area and perimeter of polygons. The diagram features an adjustable polygon with vertices marked, and the perimeter and area are calculated and displayed. Dynamic elements such as sliders control the polygon shape, and labels show the perimeter and area values. The diagram aims to help understand the changing relationship between area and perimeter, suitable for mathematics teaching.
The prompt above was compiled from the original drawing commands and is for reference only.