
Area Between 2 Polar Graphs
Loading the math board and drawing, please wait…
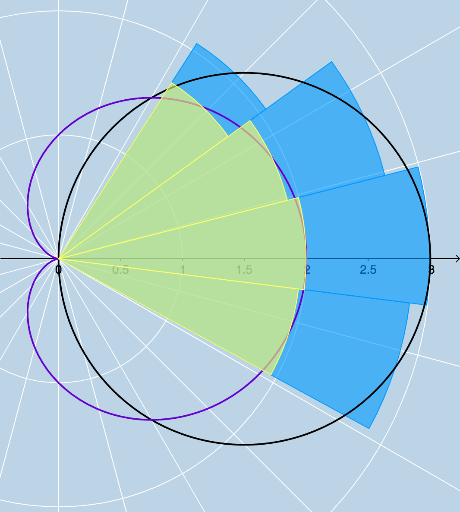
This example demonstrates how to calculate the area bounded by two polar functions. It involves core mathematical concepts like polar coordinate functions, integral calculus, and area computation. The construction utilizes GeoGebra commands such as Curve, Sequence, Textfield, FractionText, and Sum, along with objects like r, a, tmin, tmax, n, b, lists 1-6, InputBoxes 1-5, and various text and variable objects. It is suitable for high school and above students learning about the graphs and properties of polar functions and the application of integrals in geometry.
GeoGebra Commands & Parameters
CurveCartesian((r(t) * cos(t)), (r(t) * sin(t)), t, 0, 6.283185307179586) → aSequence(a(i), i, tmin, tmax, b) → list1Sequence(Segment[(0, 0), Element[list1, i]], i, 0, n) → list2Sequence(Polygon[(0, 0), Element[list1, i], Element[list1, i + 1]], i, 1, n) → list3Textfield(tmin) → InputBox1Textfield(tmax) → InputBox2Textfield(n) → InputBox3Textfield(r) → InputBox4Sequence(Segment[(0, 0), Element[list1, i]], i, 1, n) → list4FractionText(tmin / π) → text2FractionText(tmax / π) → text3Sum(list3, n) → cFractionText(d) → text5CurveCartesian((s(t) * cos(t)), (s(t) * sin(t)), t, 0, 6.283185307179586) → eTextfield(s) → InputBox5Sequence(e(i), i, tmin, tmax, b) → list5Sequence(Polygon[(0, 0), Element[list5, i], Element[list5, i + 1]], i, 1, n) → list6Sum(list6, n) → kSequence(tmin + (b * i), i, 0, n, 1) → ENDSSequence((0.5 * (Element[ENDS, i] + Element[ENDS, i + 1])), i, 1, n, 1) → REALCENTERSSequence(a(Element[REALCENTERS, i]), i, 1, n, 1) → BLUECENTERSSequence(Rotate[Element[BLUECENTERS, i], halftheta, A], i, 1, n, 1) → BLUEUPPERSSequence(Rotate[Element[BLUECENTERS, i], (-halftheta), A], i, 1, n, 1) → BLUELOWERSSequence(Sector[Circle[A, Element[BLUECENTERS, i]], Element[BLUELOWERS, i], Element[BLUEUPPERS, i]], i, 1, n, 1) → GREATERSECTORSSequence(e(Element[REALCENTERS, i]), i, 1, n, 1) → GREENCENTERSSequence(Rotate[Element[GREENCENTERS, i], halftheta, A], i, 1, n, 1) → GREENUPPERSSequence(Rotate[Element[GREENCENTERS, i], (-halftheta), A], i, 1, n, 1) → GREENLOWERSSequence(Sector[Circle[A, Element[GREENCENTERS, i]], Element[GREENLOWERS, i], Element[GREENUPPERS, i]], i, 1, n, 1) → LESSERSECTORS
AI Drawing Prompt Reference
Draw the area bounded by two polar functions, first plot the curve of the first function, then approximate the area it encloses by constructing multiple sectors, next plot the curve of the second function and construct its sectors, finally subtract the two areas to get the result, demonstrating the geometric meaning of polar coordinate functions, integral calculus, and area computation.
The prompt above was compiled from the original drawing commands and is for reference only.