
Area Above and Below the x-axis using Definite Integrals
Loading the math board and drawing, please wait…
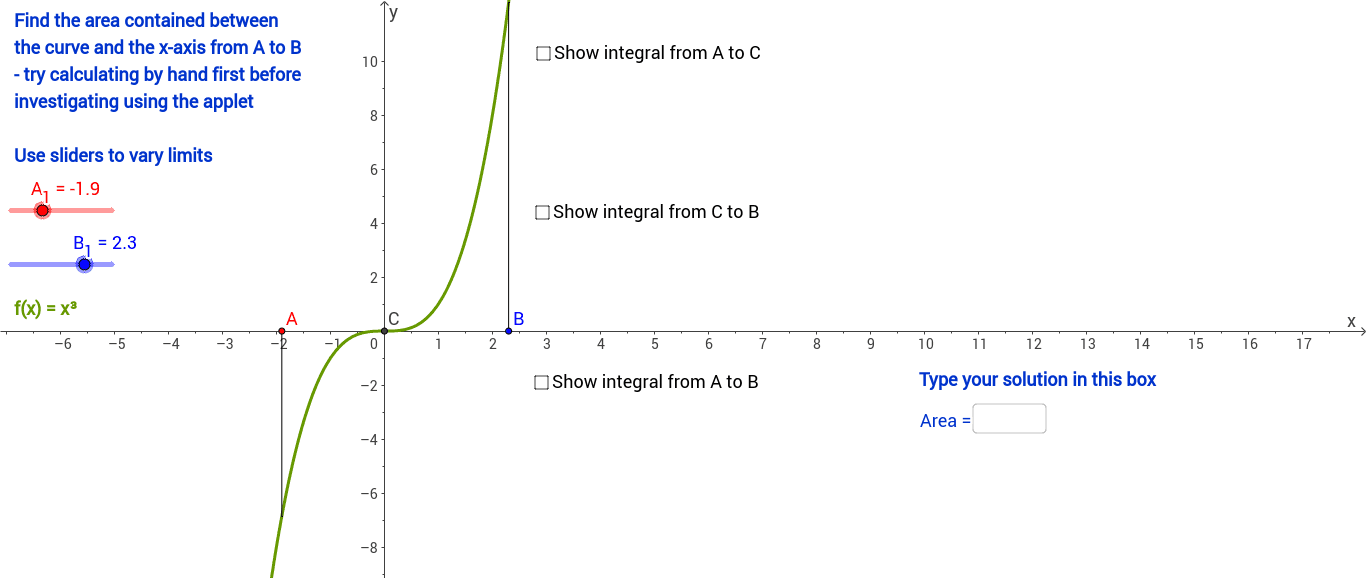
This example demonstrates the calculation of area bounded by a function and the x-axis, distinguishing between regions above and below the axis. Key concepts include definite integrals, signed area, and the impact of function sign on integration results. Construction utilizes GeoGebra commands like Integral for calculation, Intersect for finding intersection points, If for conditional logic on intervals, and Text for displaying values. It is designed for high school or college calculus students to visualize the relationship between definite integrals and geometric area.
GeoGebra Commands & Parameters
Integral(f_1, A_1, B_1) → integralABIntersect(f_1, xAxis, 1) → CIntegral(f_1, x(A), x(C)) → IntegralAtoCIntegral(f_1, x(C), x(B)) → IntegralCtoBSegment(A, AA) → d_1Segment(B, BB) → e_1Text(("f(x) = " * f_1)) → FunctionIntegral(fneg, x(A), x(B)) → IntnegIntegral(fpos, x(A), x(B)) → IntposText("Correct") → text1Text("Incorrect") → text2Text(AreaAB) → text3Textfield(text4) → InputBox1If(Textfield[] ≟ "", 0, 1) → aIf(text4 ≟ "", 0, If[text4 ≟ text3, 1, 2]) → bText("Type your solution in this box") → text5