
Deriving the Sine Graph from the Unit Circle
Loading the math board and drawing, please wait…
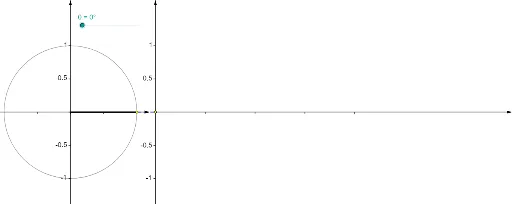
This example demonstrates how to derive the sine graph using the unit circle, involving core math concepts like the unit circle, trigonometric functions, angles, vectors, and derivatives in calculus. It utilizes GeoGebra commands/objects such as Point, Rotate, Angle, Function, Segment, Circle, Vector, and Sequence. Suitable for high school students and math enthusiasts needing to understand the relationship between trigonometric functions and calculus.
GeoGebra Commands & Parameters
Point(Ray[(0, 0), (-1, 0)]) → BRotate(A, θ, B) → PRotate(A, θ, B) → A'Angle(A, B, A') → αRotate(A, θ, B) → A'_1Angle(A, B, A'_1) → βFunction(sin((120° * x)), 0, x(Q)) → fSegment(Q, (x(Q), 0)) → eCircle(B, A) → cSegment(B, P) → aVector((x(B), y(Corner[1])), (x(B), y(Corner[4]))) → uVector((0, y(Corner[1])), (0, y(Corner[4]))) → wVector((0, 0), (x(Corner[2]), 0)) → zSequence(Segment[((0.75 * i), 0), ((0.75 * i), -0.025)], i, 1, 4) → list1Segment(P, (x(P), 0)) → bVector(B - (1.2, 0), B + (1.2, 0)) → vSequence(Segment[(0, (0.5 * i) - 1), (-0.025, (0.5 * i) - 1)], i, 0, 4) → list2Sequence(Segment[(x(B), (0.5 * i) - 1), (x(B) - 0.025, (0.5 * i) - 1)], i, 0, 4) → list3Segment(P, Q) → dSequence(Segment[B + ((0.5 * i) - 1, 0), B + ((0.5 * i) - 1, -0.025)], i, 0, 4) → list4Point(Ray[(0, 0), (-1, 0)]) → B_1Rotate(A_1, θ, B_1) → P_1Rotate(A_1, θ, B_1) → A'_2Rotate(A_1, θ, B_1) → A'_3Circle(B_1, A_1) → c_1Segment(B_1, P_1) → a_1
AI Drawing Prompt Reference
Draw a unit circle with the origin and a point on the negative x-axis. Rotate a ray from the origin by an angle to get point P, and draw the line segment from the origin to P. Calculate the angle between the origin, the starting point of the ray, and point P, and the angle between the origin, the starting point of the ray, and the endpoint of the rotated ray. Plot the sine function on the coordinate system and mark the corresponding arc length and sine value on the unit circle. Finally, use multiple line segments and arrows to show the relationship between vectors and the geometric meaning of the sine function.
The prompt above was compiled from the original drawing commands and is for reference only.