
Anti-derivative Gradient Field Visualization
Loading the math board and drawing, please wait…
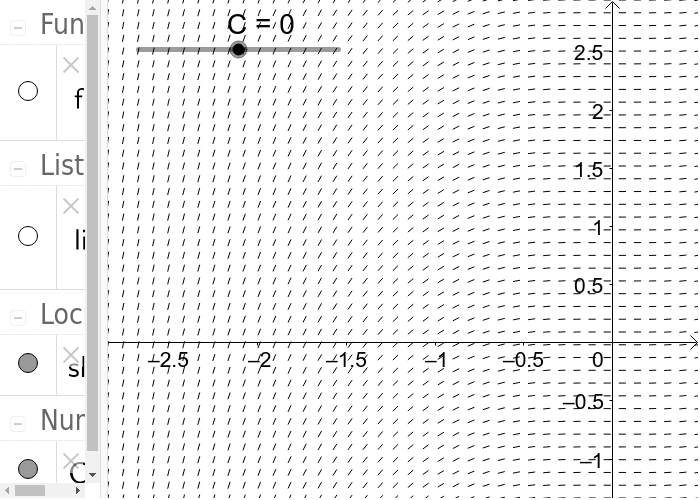
This GeoGebra example visualizes the relationship between an anti-derivative and a gradient field. It covers calculus concepts like derivatives, antiderivatives, and slope fields. Construction uses the Sequence command for point generation and SlopeField for visualization, involving objects f and list1. Ideal for high school or university calculus students to grasp the geometric interpretation of derivatives.
GeoGebra Commands & Parameters
Sequence(x^(3) / 3 + c, c, -10, 10, 0.5) → list1SlopeField(x^(2), 40) → slopefield1
AI Drawing Prompt Reference
Create a mathematical visualization showing the relationship between antiderivatives and a gradient field. First, draw a family of cubic curves in the coordinate plane, each represented by the equation x cubed divided by three plus a constant, with constants ranging from negative ten to ten in increments of zero point five, producing a series of vertically shifted parallel curves. Then, overlay a slope field based on the function x squared, using forty sample points to draw short line segments whose slopes match the value of x squared at each location. The final image should clearly illustrate how the curve family aligns with the slope field, aiding in the geometric understanding of derivatives.
The prompt above was compiled from the original drawing commands and is for reference only.