
ANOVA Based on Jittered Scatterplot
Loading the math board and drawing, please wait…
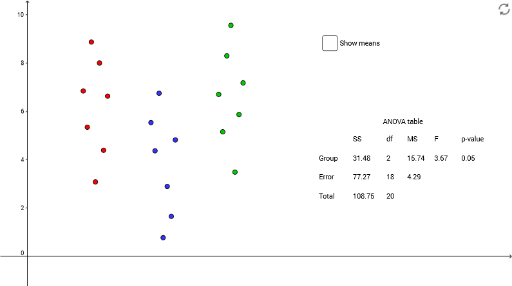
This example investigates the behavior of ANOVA with three groups by manipulating a jittered scatterplot. Students can observe how the distance between means affects the ANOVA results. The example involves statistical concepts of ANOVA and uses commands such as Point, MeanY, Segment, and Sum in GeoGebra. Suitable for high school and above students to learn about statistical analysis.
GeoGebra Commands & Parameters
Point(B1) → E1Point(B2) → E2Point(B3) → E3Point(B4) → E4Point(B5) → E5Point(B6) → E6Point(B7) → E7Point(C1) → F1Point(C2) → F2Point(C3) → F3Point(C4) → F4Point(C5) → F5Point(C6) → F6Point(C7) → F7Point(D1) → G1Point(D2) → G2Point(D3) → G3Point(D4) → G4Point(D5) → G5Point(D6) → G6Point(D7) → G7MeanY(E1:E7) → m_1MeanY(F1:F7) → m_2MeanY(G1:G7) → m_3MeanY(E1:G7) → mSegment((1 - (4 * d), m_1), (1 + (4 * d), m_1)) → a_1Segment((2 - (4 * d), m_2), (2 + (4 * d), m_2)) → a_2Segment((3 - (4 * d), m_3), (3 + (4 * d), m_3)) → a_3Segment(F1, (x(F1), m)) → L1Segment(F2, (x(F2), m)) → L2Segment(F3, (x(F3), m)) → L3Segment(F4, (x(F4), m)) → L4Segment(F5, (x(F5), m)) → L5Segment(F6, (x(F6), m)) → L6Segment(F7, (x(F7), m)) → L7Segment(G1, (x(G1), m)) → M1Segment(G2, (x(G2), m)) → M2Segment(G3, (x(G3), m)) → M3Segment(G4, (x(G4), m)) → M4Segment(G5, (x(G5), m)) → M5Segment(G6, (x(G6), m)) → M6Segment(G7, (x(G7), m)) → M7Segment((x(E1), m_1), (x(E1), m)) → N1Segment((x(E2), m_1), (x(E2), m)) → N2Segment((x(E3), m_1), (x(E3), m)) → N3Segment((x(E4), m_1), (x(E4), m)) → N4Segment((x(E5), m_1), (x(E5), m)) → N5Segment((x(E6), m_1), (x(E6), m)) → N6Segment((x(E7), m_1), (x(E7), m)) → N7Segment((x(F1), m_2), (x(F1), m)) → O1Segment((x(F2), m_2), (x(F2), m)) → O2Segment((x(F3), m_2), (x(F3), m)) → O3Segment((x(F4), m_2), (x(F4), m)) → O4Segment((x(F5), m_2), (x(F5), m)) → O5Segment((x(F6), m_2), (x(F6), m)) → O6Segment((x(F7), m_2), (x(F7), m)) → O7Segment((x(G1), m_3), (x(G1), m)) → P1Segment((x(G2), m_3), (x(G2), m)) → P2Segment((x(G3), m_3), (x(G3), m)) → P3Segment((x(G4), m_3), (x(G4), m)) → P4Segment((x(G5), m_3), (x(G5), m)) → P5Segment((x(G6), m_3), (x(G6), m)) → P6Segment((x(G7), m_3), (x(G7), m)) → P7Segment((1 - (13 * d), m), (3 + (13 * d), m)) → aSegment((x(E1), m_1), E1) → H1Segment((x(E2), m_1), E2) → H2Segment((x(E3), m_1), E3) → H3Segment((x(E4), m_1), E4) → H4Segment((x(E5), m_1), E5) → H5Segment((x(E6), m_1), E6) → H6Segment((x(E7), m_1), E7) → H7Segment((x(F1), m_2), F1) → I1Segment((x(F2), m_2), F2) → I2Segment((x(F3), m_2), F3) → I3Segment((x(F4), m_2), F4) → I4Segment((x(F5), m_2), F5) → I5Segment((x(F6), m_2), F6) → I6Segment((x(F7), m_2), F7) → I7Segment((x(G1), m_3), G1) → J1Segment((x(G2), m_3), G2) → J2Segment((x(G3), m_3), G3) → J3Segment((x(G4), m_3), G4) → J4Segment((x(G5), m_3), G5) → J5Segment((x(G6), m_3), G6) → J6Segment((x(G7), m_3), G7) → J7Segment((x(E1), m), E1) → K1Segment((x(E2), m), E2) → K2Segment((x(E3), m), E3) → K3Segment((x(E4), m), E4) → K4Segment((x(E5), m), E5) → K5Segment((x(E6), m), E6) → K6Segment((x(E7), m), E7) → K7Sum(K1:M7^(2)) → SSTSum(N1:P7^(2)) → SSGSum(H1:J7^(2)) → SSEANOVA({y(E1:E7), y(F1:F7), y(G1:G7)}) → list1Ellipse(I, J, K) → hEllipse(G, H, L) → kEllipse(E, F, M) → q
AI Drawing Prompt Reference
Draw a scatter plot with three groups, each containing seven points. Adjust the positions of the points to observe how the distance between group means affects the ANOVA results. Draw the mean lines for each group and vertical segments from each point to the mean line. Finally, draw horizontal segments from each group mean to the overall mean.
The prompt above was compiled from the original drawing commands and is for reference only.