
Animation Demonstrating Linear Equations and Probability Statistics
Loading the math board and drawing, please wait…
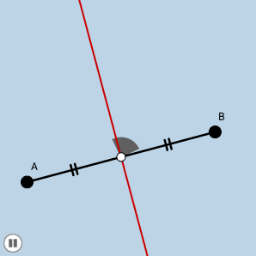
This example demonstrates linear equations and probability statistics, including scatter plots, binomial distributions, and histograms through animation. Key math concepts involve linear equations, statistical graphs, binomial distributions, and probability calculations. GeoGebra commands like Segment, Midpoint, LineBisector, Circle, Intersect, CircleSector, Dilate, and Rotate are used to construct and animate the graphics. Suitable for high school mathematics education, illustrating the integration of data analysis and geometric transformations.
GeoGebra Commands & Parameters
Segment(A, B) → fMidpoint(f) → CLineBisector(f) → pCircle(C, (0.1 * f)) → cIntersect(c, f, 2) → DIntersect(c, p, 2) → ECircleSector(C, D, E) → dDilate(A, If[0 < a ≤ 1, 1 - a, 0], C) → A'Segment(A, A') → hDilate(C, If[1 < a ≤ 2, 2 - a, 0], B) → C'Segment(C, C') → iRotate(A, If[2 < a ≤ 3, ((-(a - 2)) * π), (-π)], C) → A'_1Rotate(A', If[2 < a ≤ 3, ((a - 2) * π), π], C) → A''Segment(A'_1, A'') → h'Rotate(d, If[3 < a ≤ 4, ((a - 3) * π / 2), π / 2], C) → d'