
Animation 67
Loading the math board and drawing, please wait…
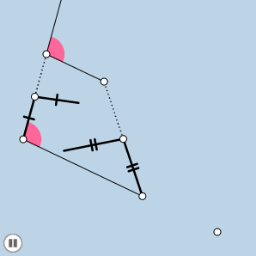
This example demonstrates animations of trapezoids, power functions, sine functions, normal distributions, percentages, and histograms. Using GeoGebra commands such as Line, Ray, Point, Segment, Slope, PointIn, etc., a dynamic geometric figure is constructed. Suitable for high school mathematics education, particularly for teaching coordinate geometry and function graphs.
GeoGebra Commands & Parameters
Line(A, B) → fRay(A, B) → gPoint(g) → CRay(A, C) → hSegment(A, C) → iSlope(f) → mPointIn(a) → DSegment(A, D) → jLine(D, i) → kPoint(k) → ERay(D, E) → lPoint(l) → FRay(D, F) → nSegment(F, C) → pSegment(D, F) → qMin(j, i) → cCircle(A, (0.2 * c)) → dIntersect(d, j, 1) → GIntersect(d, i, 1) → HCircleSector(A, H, G) → eAngle(C, A, D) → αCircleSector(A, G, H) → rDilate(A, If[0 < o ≤ 1, 1 - o, 0], C) → A'Midpoint(D, A) → IMidpoint(F, C) → JSegment(A, A') → sDilate(F, If[0 < o ≤ 1, 1 - o, 0], D) → F'Segment(F, F') → tDilate(A, If[1 < o ≤ 2, 2 - o, 0], D) → A'_1Segment(A, A'_1) → f_1Ray(A, D) → g_1Point(g_1) → KRay(D, K) → h_1Dilate(A, If[2 < o ≤ 3, 3 - o, 0], D) → A'_2Vector(A, A'_2) → uTranslate(e, u) → e'Dilate(A, If[3 < o ≤ 4, 4 - o, 0], I) → A'_3Dilate(C, If[3 < o ≤ 4, 4 - o, 0], J) → C'Segment(A, A'_3) → i_1Segment(C, C') → j_1Dilate(I, If[4 < o ≤ 5, 5 - o, 0], D) → I'Dilate(J, If[4 < o ≤ 5, 5 - o, 0], F) → J'Segment(I, I') → k_1Segment(J, J') → l_1Rotate(A, If[5 < o ≤ 6, ((o - 5) * π), π], I) → A'_4Rotate(A'_3, If[5 < o ≤ 6, ((o - 5) * π), π], I) → LSegment(A'_4, L) → m_1Polygon(A, C, F, D) → poly1, a_1, c_1, f_2, d_1Rotate(C, If[5 < o ≤ 6, ((-(o - 5)) * π), (-π)], J) → C'_1Rotate(C', If[5 < o ≤ 6, ((-(o - 5)) * π), (-π)], J) → C''Segment(C'_1, C'') → n_1Dilate(I, If[6 < o ≤ 7, 7 - o, 0], J) → I'_1Segment(I, I'_1) → p_1Dilate(D, If[7 < o ≤ 8, 8 - o, 0], I) → D'Vector(D, D') → vTranslate(e', v) → e''Translate(r, u) → r'Translate(r', v) → r''Rotate(A, If[8.5 < o ≤ 9.5, ((-(o - 8.5)) * π), (-π)], J) → A'_5Rotate(C, If[8.5 < o ≤ 9.5, ((-(o - 8.5)) * π), (-π)], J) → C'_2Rotate(F, If[8.5 < o ≤ 9.5, ((-(o - 8.5)) * π), (-π)], J) → F'_1Rotate(D, If[8.5 < o ≤ 9.5, ((-(o - 8.5)) * π), (-π)], J) → D'_1Polygon(A'_5, C'_2, F'_1, D'_1) → poly1', a'_5, c'_2, f'_1, d'_1Dilate(I, If[10 < o ≤ 11, 11 - o, 0], D) → I'_2Vector(I, I'_2) → wTranslate(I, w) → I'_3Translate(I'_1, w) → MSegment(I'_3, M) → q_1Dilate(I, If[11 < o ≤ 12, 12 - o, 0], M) → I'_4Dilate(I, If[11 < o ≤ 12, 12 - o, 0], M) → I'_5Vector(I, I'_5) → u_1Translate(I, u_1) → I'_6Translate(I'_1, u_1) → NSegment(I'_6, N) → r_1
AI Drawing Prompt Reference
Create a dynamic geometric figure with a line and a ray, then place a point on the ray and connect it to the origin. Add another point in a different area, construct several rays and segments to form a quadrilateral. Use circles and sectors to represent angles, and include a slider to control multiple animation phases involving scaling, translation, and rotation of points, as well as dynamic changes to segments and sectors. The figure includes trapezoids, power functions, sine waves, normal distributions, percentages, and histograms, suitable for high school teaching.
The prompt above was compiled from the original drawing commands and is for reference only.