
Animation 282: Circle and Angle Interaction Demo
Loading the math board and drawing, please wait…
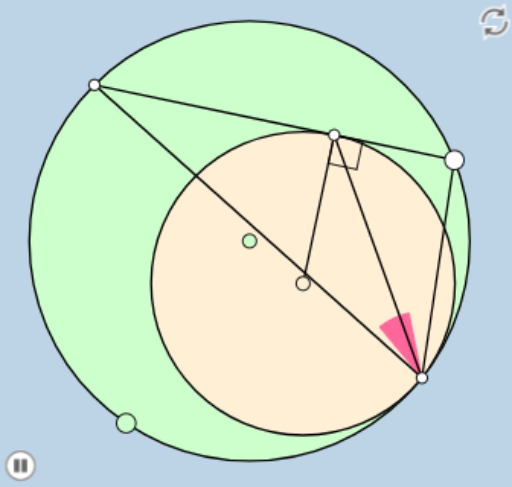
This example demonstrates the dynamic interaction between circles and angles through animation, showcasing the changes in central angles, chord lengths, and function graphs. Core mathematical concepts include circles, angles, function graphs, limits, and sequences. GeoGebra commands used in construction are Circle, Segment, PointIn, Distance, Intersect, Point, Tangent, Ray, Min, CircleSector, Angle, Dilate, and Rotate. Suitable for high school mathematics education to understand circle properties, function graph plotting, and limit concepts.
GeoGebra Commands & Parameters
Circle(A, B) → cSegment(A, B) → fPointIn(b) → CDistance(C, c) → dCircle(C, d) → eIntersect(e, c) → D, , ,Point(c) → ETangent(E, e) → g, hIntersect(c, g, 2) → FIntersect(e, g) → GRay(D, E) → iRay(D, F) → jRay(D, G) → kSegment(D, F) → lSegment(D, G) → mSegment(D, E) → nMin({l, m, n}) → oCircle(D, (0.3 * o)) → pIntersect(p, k, 1) → HIntersect(p, i, 1) → ICircleSector(D, I, H) → qAngle(C, G, E) → αDilate(E, If[0 < r ≤ 1, 1 - r, 0], G) → E'Segment(E, E') → sDilate(G, If[1 < r ≤ 2, 2 - r, 0], F) → G'Segment(G, G') → tDilate(C, If[2 < r ≤ 3, 3 - r, 0], G) → C'Segment(C, C') → f_1Dilate(D, If[3 < r ≤ 4, 4 - r, 0], G) → D'Dilate(D, If[3 < r ≤ 4, 4 - r, 0], E) → D'_1Dilate(D, If[3 < r ≤ 4, 4 - r, 0], F) → D'_2Segment(D, D'_1) → g_1Segment(D, D') → h_1Segment(D, D'_2) → i_1Angle(E, D, G) → βRotate(I, If[4 < r ≤ 5, ((r - 4) * β), β], D) → I'CircleSector(D, I, I') → c_1Rotate(q, If[6 < r ≤ 7, ((r - 6) * β), β], D) → q'Circle(A, B) → ccCircle(C, D) → ee
AI Drawing Prompt Reference
Draw a dynamic illustration showing the interaction between circles and angles, highlighting changes in central angles, chord lengths, and function graphs. Start by drawing a circle and a chord, then take a point on the chord and draw a circle with the point as the center, intersecting the original circle at two points. Next, draw a circle with one of the intersection points as the center, intersecting the previous circle at another point. Draw rays from the intersection points to the center, calculate the chord lengths, and plot the function graphs. Finally, show the dynamic changes in angles and the graphical representation.
The prompt above was compiled from the original drawing commands and is for reference only.