
Animated Place Value
Loading the math board and drawing, please wait…
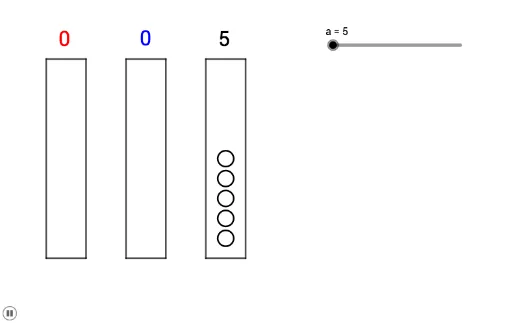
This example demonstrates the change in place value through animation. It involves core mathematical concepts such as place value, percentages, and median lines. Using GeoGebra commands like Segment and Sequence, it dynamically shows the increase and decrease of place values. Suitable for high-grade elementary and junior high school students to learn about place value and percentages.
GeoGebra Commands & Parameters
Segment(D, C) → fSegment(C, B) → gSegment(B, A) → hSegment(A, D) → iSegment(H, G) → jSegment(G, F) → kSegment(F, E) → lSegment(E, H) → mSegment(L, K) → nSegment(K, J) → pSegment(J, I) → qSegment(I, L) → rSequence(Circle[Point[{9, n + 1}], 0.4], n, 0, b - 1) → L_1Sequence(Circle[Point[{5, n + 1}], 0.4], n, 0, c - 1) → L_2Sequence(Circle[Point[{1, n + 1}], 0.4], n, 0, d - 1) → L_3
AI Drawing Prompt Reference
Create an animation to demonstrate changes in place values. Use a slider to adjust the value, and connect points A, B, C, and D with line segments to form a rectangle. Inside the rectangle, draw three concentric circles at the left, middle, and right positions, with a radius of 0.4. As the slider changes, the circles will move accordingly, showing the process of place value changes.
The prompt above was compiled from the original drawing commands and is for reference only.