
Analysis of Sine Function Graphs
Loading the math board and drawing, please wait…
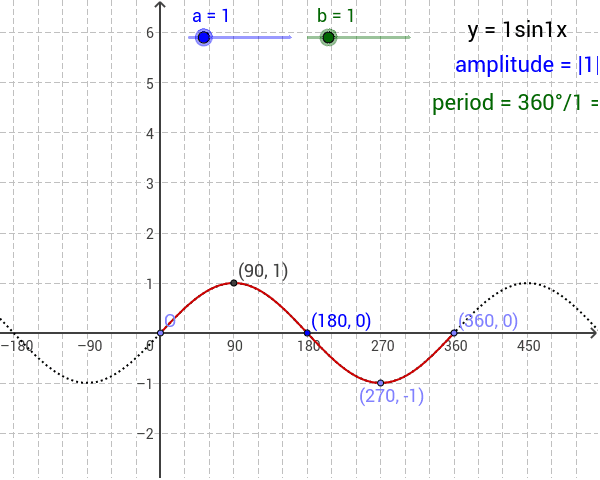
This GeoGebra example demonstrates the analysis of sine function graphs, focusing on how changes in amplitude and period affect the waveform. Users can interactively adjust parameters to observe real-time transformations of the sine curve. Key mathematical concepts include the sine function, amplitude, period, trigonometric functions, and geometric transformations. The construction employs the GeoGebra Function command to define functions f and g, with parameters a and b controlling amplitude and period. Auxiliary objects such as points B, C, D, A, and texts T1, T2, T3 are used for labeling and visualization, while O likely represents the origin. It is suitable for high school mathematics education, particularly in trigonometry units, to enhance understanding of function properties and graphing techniques.
GeoGebra Commands & Parameters
Function(f, 0, 360 / b) → g