
Airlines Cost Function Graphing
Loading the math board and drawing, please wait…
In collections
CCGPS AA Unit 6 Lesson 1
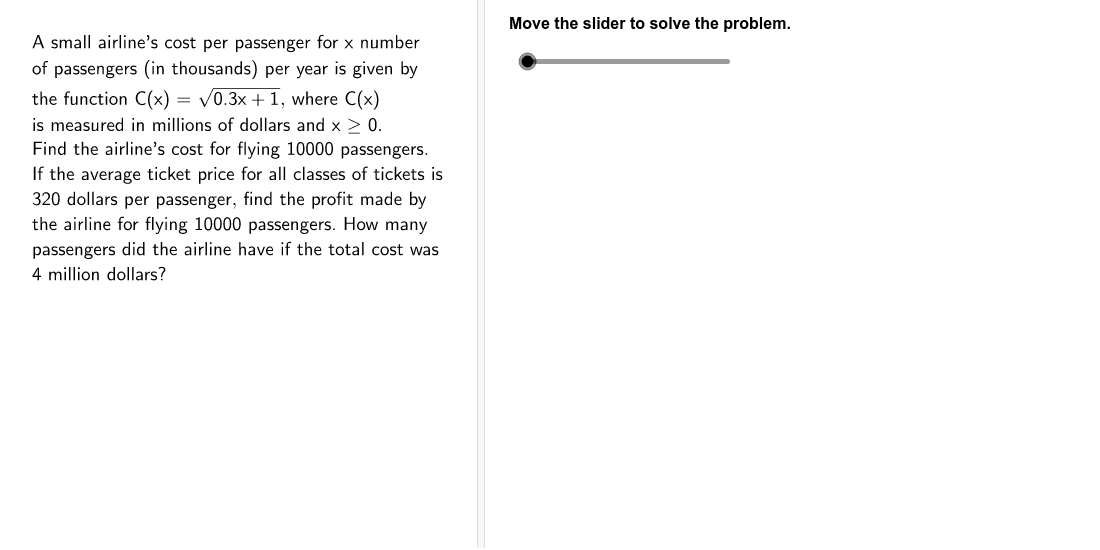
This example demonstrates how the cost function of an airline changes with the number of passengers. Key math concepts include functions, square root functions, and cost functions. Constructed using GeoGebra commands such as Textfield, Slider, and Function, it is suitable for high school math education.
GeoGebra Commands & Parameters
Textfield(TicketPrice) → TicketPriceBoxTextfield(NumPassThousands) → NumPassThousandsBoxTextfield(CostSet) → CostSetBox
AI Drawing Prompt Reference
Create a graph of an airline's cost function, with the x-axis representing the number of passengers (in thousands) and the y-axis representing the cost. Use a slider to adjust the ticket price and cost settings. First, set the ticket price, then set the slider for the number of passengers, and finally plot the cost function based on these parameters.
The prompt above was compiled from the original drawing commands and is for reference only.