
Addition & Subtraction Visualized with Polygons
Loading the math board and drawing, please wait…
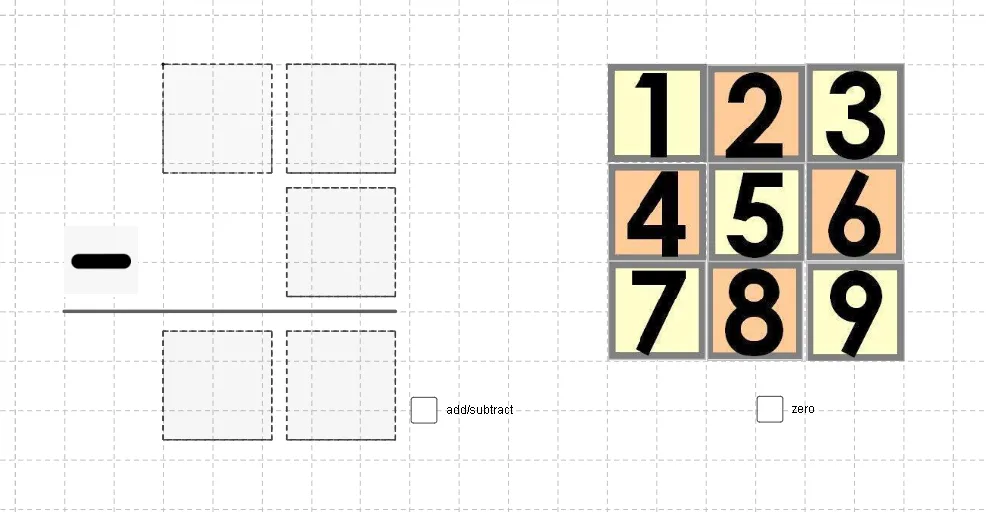
This GeoGebra example visualizes addition and subtraction operations through geometric constructions, primarily using polygons and segments to represent numerical values. It demonstrates how arithmetic operations can be interpreted as area or length comparisons, making abstract concepts tangible. The core mathematical concepts include basic arithmetic, addition, subtraction, and connections to complex numbers, exponents, quadratic functions, and ellipses. The construction employs the Polygon command to create multiple polygons (poly1, poly2, poly3) and the Segment command for line segments, with numerous objects (u, pic1-pic10, A-N) supporting the interactive display. Suitable for elementary to middle school students learning arithmetic, and useful for teachers creating dynamic math lessons. Users can manipulate parameters to observe how operations affect the geometric representations.
GeoGebra Commands & Parameters
Polygon(A, B, 4) → poly1, a, b, c, d, C, DPolygon(E, F, 4) → poly2, e, f, g, h, G, HPolygon(I, J, 4) → poly3, i, j, k, l, K, LPolygon(M, N, 4) → poly4, m, n, p, q, O, PPolygon(Q, R, 4) → poly5, r, s, t, a_1, S, TSegment(U, V) → b_1
AI Drawing Prompt Reference
Draw five quadrilaterals and one line segment to visualize addition and subtraction operations. Four quadrilaterals are arranged in sequence, each representing a value, while the fifth quadrilateral displays the operation result. One line segment serves as a reference for length or numerical comparison. The varying areas of these polygons intuitively demonstrate addition (area increase) and subtraction (area decrease), presenting a clear geometric correspondence that helps understand abstract arithmetic operations.
The prompt above was compiled from the original drawing commands and is for reference only.