
Add and Subtract: Geometric and Function Plotting Example
Loading the math board and drawing, please wait…
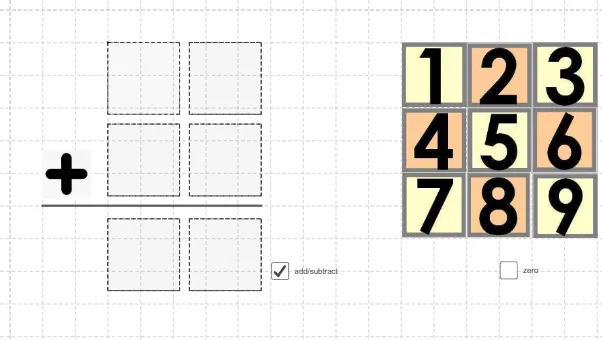
This example demonstrates how to understand the concepts of addition and subtraction through geometric figures and function graphs. The key mathematical concepts involved include geometric construction, graphing functions, and coordinate geometry. The construction involves using GeoGebra commands like Polygon and Segment to create shapes, along with trigonometric and exponential functions for visualization. It is suitable for middle or high school mathematics learning to help understand the practical application and graphical representation of mathematical concepts.
GeoGebra Commands & Parameters
Polygon(A, B, 4) → poly1, a, b, c, d, C, DPolygon(E, F, 4) → poly2, e, f, g, h, G, HPolygon(I, J, 4) → poly3, i, j, k, l, K, LPolygon(M, N, 4) → poly4, m, n, p, q, O, PPolygon(Q, R, 4) → poly5, r, s, t, a_1, S, TSegment(U, V) → b_1Polygon(C_1, D_1, 4) → poly6, f_1, g_1, h_1, i_1, E_1, F_1
AI Drawing Prompt Reference
On the same coordinate plane, draw several congruent-style polygons to form a geometric composite layout: first create one closed polygon with four sides and connect its vertices to outline the shape. Then place and construct a second, third, and fourth four-sided polygon in different regions, each using its own vertices connected in order to form a closed figure. Next add a fifth polygon with the same overall style. Include also a single line segment determined by two points to highlight a local relationship between the parts. Finally, construct one more four-sided polygon beside the existing figures, again closed by connecting its vertices in sequence.
The prompt above was compiled from the original drawing commands and is for reference only.