
Fraction Pie
Loading the math board and drawing, please wait…
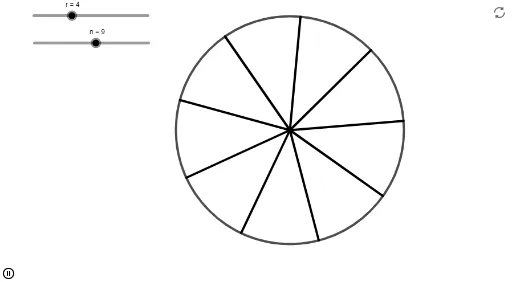
This example uses a dynamic pie chart to illustrate the concept of fractions. It involves key mathematical concepts such as fractions, angles, and geometric transformations. Using GeoGebra commands like Circle, Point, Rotate, and Angle, users can visually understand how fractions are represented in a pie chart. Suitable for high-grade elementary to junior high school students learning fractions and geometric transformations.
GeoGebra Commands & Parameters
Circle(A, r) → cPoint(c) → BRotate(B, 60°, A) → B'Angle(B, A, B') → αSequence(Rotate[B, (360 * (k / n)°), A], k, 1, n - 1) → l1Sequence(Segment[A, Rotate[B, (360 * (k / n)°), A]], k, 1, n) → l2
AI Drawing Prompt Reference
Draw a circle and place a point on it. Rotate this point 60 degrees around the center to get another point, and mark the angle formed by the line connecting these two points and the center. Then, rotate this point at equal angles around the center to get multiple points, and connect these points to the center with line segments to create a fraction pie chart.
The prompt above was compiled from the original drawing commands and is for reference only.