
1-Proportion Simulation: Hypergeometric Sampling with Dot Plot
Loading the math board and drawing, please wait…
In collections
Math Year 4 Unit Probability & Statistics
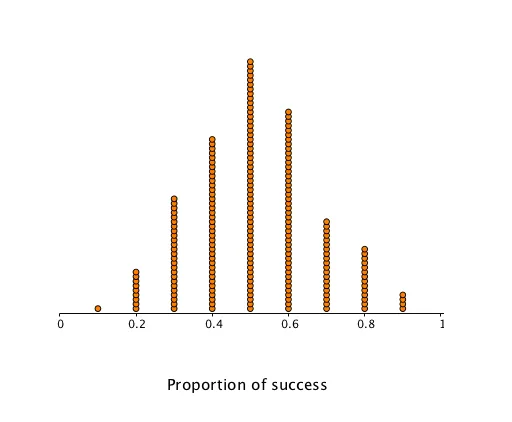
① This interactive GeoGebra example simulates the sampling distribution of a single proportion, allowing users to adjust the population proportion p and sample size n to observe how the dot plot of simulated sample proportions changes. ② It focuses on the hypergeometric distribution, proportion estimation, sampling variability, and random simulation, integrating real-number arithmetic and conditional logic. ③ The construction employs GeoGebra commands including Textfield, InputBox, Length, Point, Polygon, If, and DotPlot, with objects such as p, n, data, buttons (button1-6), text boxes (text1-5), polygon poly1, and lists list1/list2 to manage inputs, trigger simulations, and display statistical summaries. ④ This resource is ideal for high school or college statistics courses, AP Statistics, or introductory probability classes, helping students grasp how sample proportions vary randomly and how parameters influence the distribution.
GeoGebra Commands & Parameters
Textfield(p) → InputBox1Textfield(n) → InputBox2Length(data) → bPoint(xAxis) → APolygon({(-0.01, -0.5), (1.01, -0.5), (1.01, 4), (-0.01, 4)}) → poly1If(less, x ≤ x(A), x ≥ x(A)) → dDotPlot(data, false, 15 / Length[data]) → list1