
Making Bar Graphs: Dynamic Data Visualization with GeoGebra
Loading the math board and drawing, please wait…
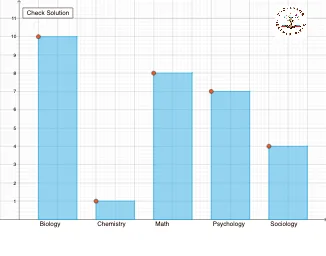
① This GeoGebra example illustrates how to construct bar graphs dynamically from raw data, using sequence, counting, and polygon commands to display frequency distributions and statistical summaries. ② Core mathematical concepts include bar chart construction, frequency counting, expected value, standard deviation, and set theory classification of data elements. ③ Construction highlights: the Sequence command generates data series, CountIf tallies frequencies per interval, and Line and Polygon commands draw the bars' outlines and fills; objects include multiple data variables (bio1–bio28) and a button (button1) for interactive updates, while conic sections and cuboid objects hint at additional geometric or 3D visual aids. ④ This resource is ideal for high school to early college statistics and probability courses, math labs, or teachers creating interactive lessons to help students grasp data visualization and the geometric interpretation of statistical measures.
GeoGebra Commands & Parameters
Sequence(Random[1, 5], i, 1, v, 1) → major, {4, 1, 3, 4, 2, 1, 4, 2, 2, 5, 5, 5, 3, 2, 2, 4, 4, 2, 3, 3, 1, 2, 3, 4, 2, 5, 5, 2, 2, 2}CountIf(x ≟ 1, major) → bioCountIf(x ≟ 2, major) → chemCountIf(x ≟ 3, major) → mathCountIf(x ≟ 4, major) → psyCountIf(x ≟ 5, major) → socLine(A, K) → fLine(B, L) → gLine(D, N) → iLine(E, O) → jLine(F, P) → kLine(G, Q) → lLine(H, R) → mLine(I, S) → nLine(J, T) → pPolygon(A, K, L, B) → q1, a, k_1, l_1, bPolygon(O, P, F, E) → q3, o, p_1, f_1, ePolygon(Q, R, H, G) → q4, q, r, h_1, g_1Polygon(S, T, J, I) → q5, s, t, j_1, i_1Polygon(V, C, D, N) → q2, v_1, c, d, n_1
AI Drawing Prompt Reference
Create a dynamic bar graph to display the frequency distribution of randomly generated data ranging from 1 to 5. Use a sequence command to generate the data, then count the occurrences of each value using counting commands to determine the heights of the bars. Draw the outlines of the bars with line commands and fill them with polygon commands, categorizing the bars into five groups corresponding to the values 1 through 5. Include a slider for interactive data updates and display statistical summaries such as frequency distributions and standard deviations.
The prompt above was compiled from the original drawing commands and is for reference only.