
旋转极坐标曲线
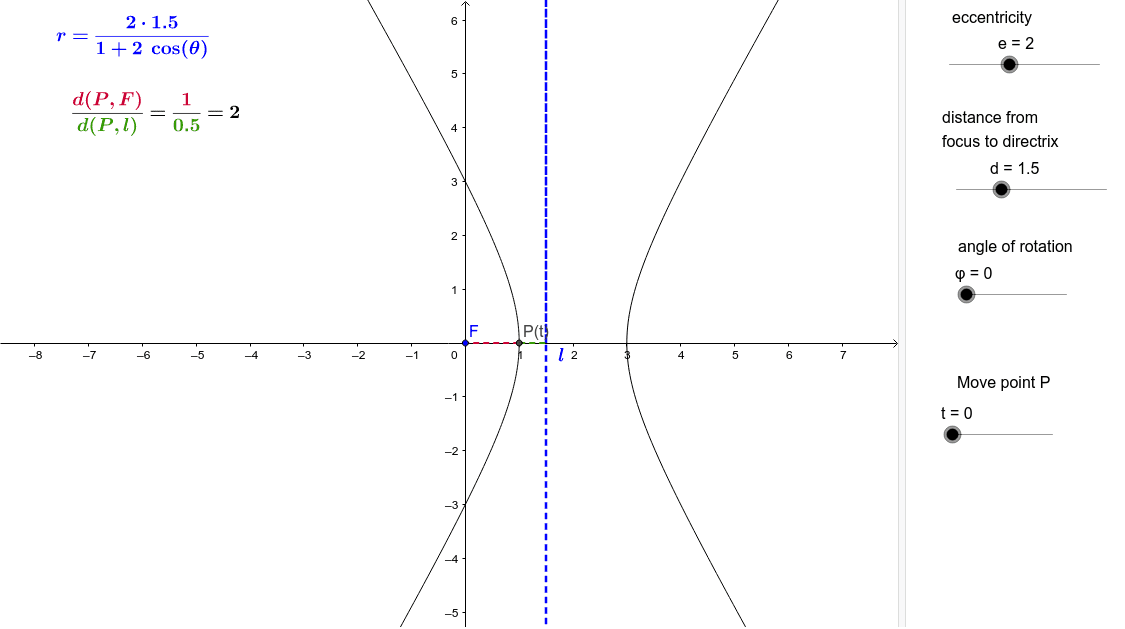
几何画板及绘图内容加载中,请稍等……
所属专题
Conics Doug Kuhlmann
这个范例演示了旋转极坐标曲线的动态变化。核心数学概念包括极坐标系下的双曲线和抛物线。通过使用GeoGebra命令如CurveCartesian、Point、Line等,可以直观地展示曲线的生成过程。适合高中数学教学,特别是解析几何和曲线变换的教学。
GeoGebra 命令及参数
CurveCartesian((rd(θ) * cos(θ)), (rd(θ) * sin(θ)), θ, 0, 6.2831) → d_1Point(d_1) → BPoint(d_1) → ALine(A, B) → gCurveCartesian((r(θ) * cos(θ)), (r(θ) * sin(θ)), θ, 0, 6.28319) → aOrthogonalLine(P, g) → hIntersect(g, h) → CSegment(P, C) → fSegment(P, F) → c