
极坐标绘图器 by Doug Kuhlmann
几何画板及绘图内容加载中,请稍等……
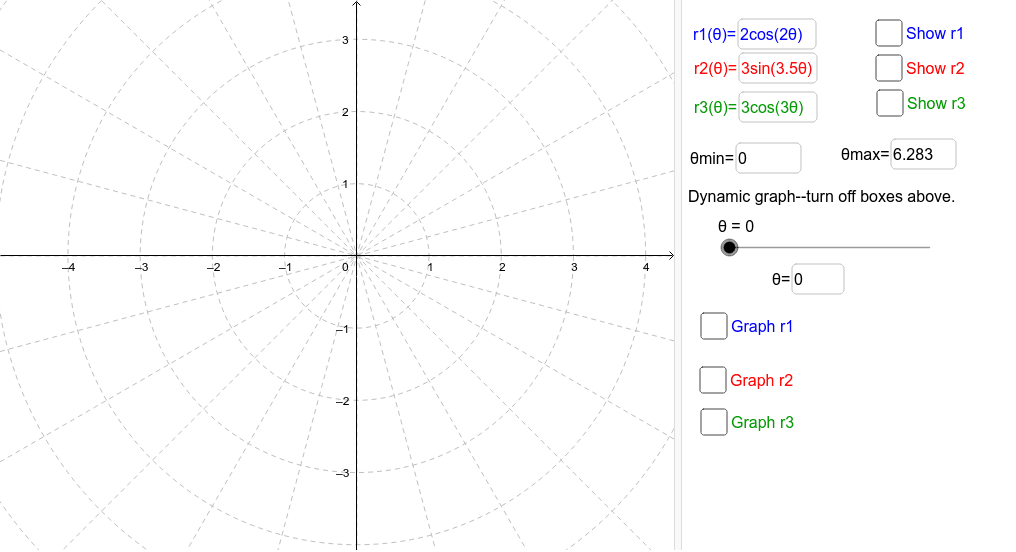
这个范例演示了如何使用GeoGebra绘制极坐标图。它涉及极坐标系中的基本概念,如极径和极角。通过输入不同的极坐标方程,可以观察到各种图形的变化。主要使用了CurveCartesian、Textfield等命令,适合高中数学教学和学习。
GeoGebra 命令及参数
CurveCartesian((r1(t) * cos(t)), (r1(t) * sin(t)), t, θmin, θmax) → aCurveCartesian((r2(t) * cos(t)), (r2(t) * sin(t)), t, θmin, θmax) → bTextfield(r1) → r1InputTextfield(r2) → r2InputTextfield(θmin) → ΘminTextfield(θmax) → ΘmaxCurveCartesian((r3(t) * cos(t)), (r3(t) * sin(t)), t, θmin, θmax) → cTextfield(r3) → r3InputCurveCartesian((r1(t) * cos(t)), (r1(t) * sin(t)), t, θmin, θ) → a1CurveCartesian((r3(t) * cos(t)), (r3(t) * sin(t)), t, θmin, θ) → c1CurveCartesian((r1(t) * cos(t)), (r1(t) * sin(t)), t, θmin, θmax) → a2CurveCartesian((r2(t) * cos(t)), (r2(t) * sin(t)), t, θmin, θmax) → b2CurveCartesian((r3(t) * cos(t)), (r3(t) * sin(t)), t, θmin, θmax) → c2CurveCartesian((r2(t) * cos(t)), (r2(t) * sin(t)), t, θmin, θ) → b1Textfield(θ) → ThetaEquals