
极坐标圆锥曲线演示 by Chris Mizell
几何画板及绘图内容加载中,请稍等……
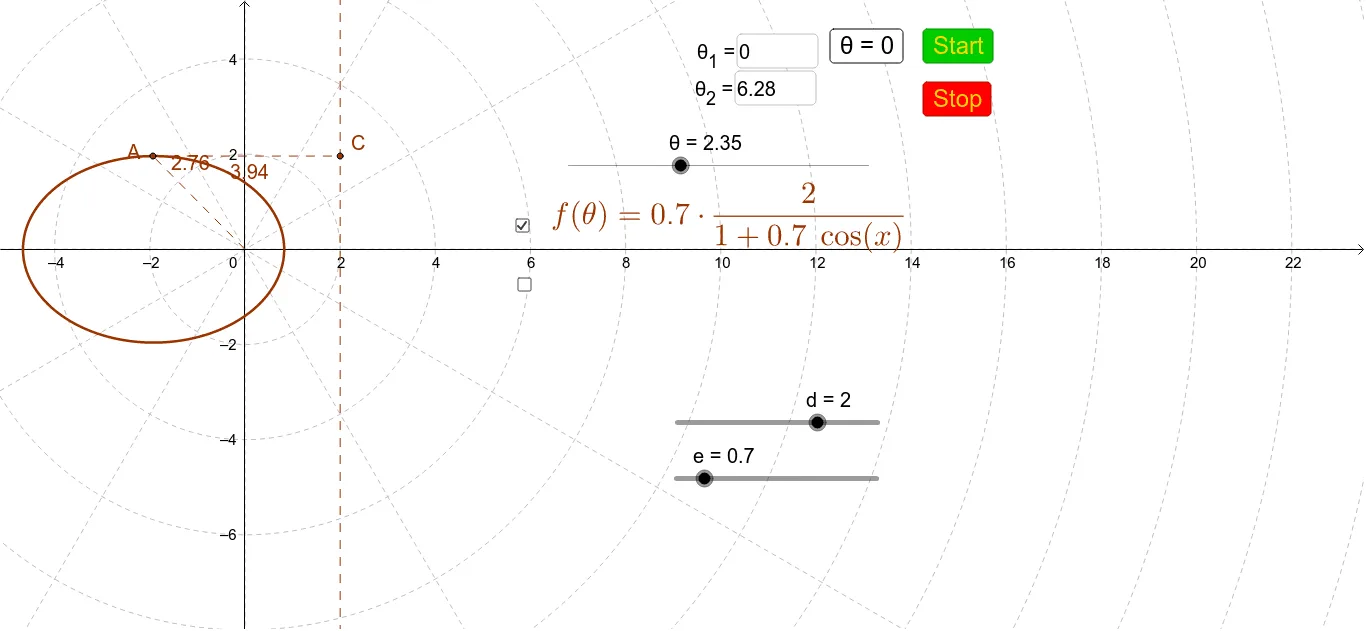
①本范例通过动态调整准线和离心率,演示极坐标下的圆锥曲线(椭圆、双曲线、抛物线)的形成与变化;②涉及核心数学概念包括极坐标方程、圆锥曲线的定义与性质、离心率对曲线形态的影响;③作图要点:使用Textfield、CurveCartesian、Segment等GeoGebra命令和对象,通过滑块动态展示准线、离心率及曲线变化;④适合高中数学教学,用于直观理解圆锥曲线的几何本质和参数方程。
GeoGebra 命令及参数
Textfield(f) → inputBox1Textfield(θ_1) → inputBox2Textfield(θ_2) → inputBox3Textfield(g) → inputBox4CurveCartesian((f(θ) * cos(θ)), (f(θ) * sin(θ)), θ, θ_1, θ_2) → d_1Segment((0, 0), (((-10) * cos(θ)), ((-10) * sin(θ)))) → cCurveCartesian((g(θ) * cos(θ)), (g(θ) * sin(θ)), θ, θ_1, θ_2) → iSegment(A, C) → mSegment((0, 0), A) → hSegment(B, D) → pSegment((0, 0), B) → q