
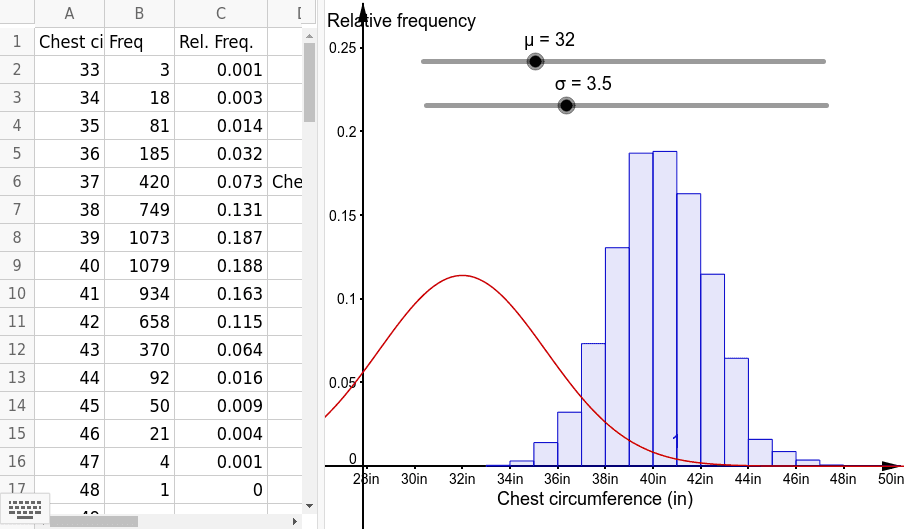
胸围测量数据的正态分布:频数表、直方图与正态曲线
几何画板及绘图内容加载中,请稍等……
① This example demonstrates the normal distribution using a set of chest measurement data, including a frequency table, histogram, and fitted normal curve. ② Core mathematical concepts include the normal (Gaussian) distribution, frequency distribution, histograms, probability density functions, and statistical data visualization. ③ Construction highlights: the GeoGebra commands Sum, Histogram, and Normal are used; numerous data objects (A1 to C3) store measurement values, frequencies, and computed parameters. ④ Suitable for high school or introductory college statistics courses, helping students understand data shape, central tendency, spread, and how a normal curve approximates real-world data.
GeoGebra 命令及参数
Sum(B2:B17) → B20Histogram(list1, list3) → aNormal(μ, σ, x) → f