
函数与其导数匹配
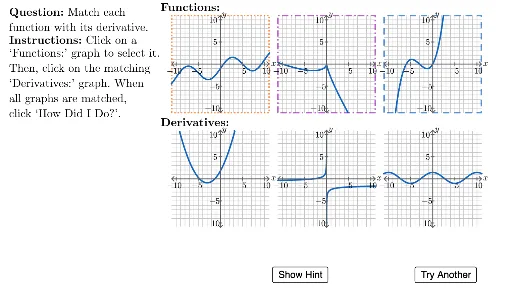
几何画板及绘图内容加载中,请稍等……
①本范例演示如何将函数图像与其导数图像进行匹配;②涉及的核心数学概念包括函数、导数、图像识别;③作图要点——从下方『构造摘要』提炼用到了 Zip, Random, Flatten, NumberListToLatex, Shuffle, Polygon, Join, If, LaTeX, Translate, UnicodeToLetter, Sequence, Element, Derivative, Intersect 等GeoGebra命令/对象;④适合高中阶段学生学习微积分,理解函数与导数之间的关系。
GeoGebra 命令及参数
Zip(Rotate[{Segment[(11, 0), (10.5, 0.5)], Segment[(11, 0), (10.5, -0.5)]}, A, (0, 0)], A, {0, 90°, 180°, 270°}) → TemplateAxisArrowsRandom(-5, 5) → t3var2Random(3, 10) → t3var1Flatten({Zip[x(A), A, {Intersect[t3Derivative1, 0, -10, t3var2]}], Zip[x(A), A, {Intersect[t3Derivative2, 0, t3var2Negative, 10]}]}) → t3zerosRandom(-9, -5) → t22y1Random(t22y1 + 2, t22y1 + 5) → t22y3Random(t22y3 + 1, 9) → t22y4Random(t22y3 + 2, t22y3 + 4) → t22y2Random(t22x1 + 2, t22x1 + 5) → t22x2Random(t22x2 + 2, Min[8, 8 - t22x2]) → t22x3Random(-4, 4) → a2Zip(Derivative[A], A, t2Funcs) → t2DerivativesZip(round(x(A), 1), A, {Intersect[Element[t2Derivatives, 1], 0, -11, 11]}) → t21zerosNumberListToLatex(t21zeros) → t21zerosTXTRandom(1, 2) → t2IndxRandom(a2 + 1, a2 + 4) → a3Random(-8, -2) → c2Random(c2 + 1, c2 + 3) → c3Random(c3 + 1, c3 + 3) → c4Random(c4 + 1, c4 + 3) → c5Random(-8, 0) → b2Random(b2 + 1, b2 + 4) → b3Random(b3 + 1, b3 + 4) → b4Shuffle({1, 2, 3}) → questionOrderFlatten(Sequence[Sequence[(i, j), i, -15, -15 + (2 * 24), 24], j, 10, 10 - 26, -26]) → transVectorsPolygon({(-11, -11), (-11, 11), (11, 11), (11, -11)}) → polygonTemplateShuffle({-1, 2, -2, 1}) → t1aValsShuffle({2, 3, 4, 5, 6, -2, -3, -4, -5, -6}) → t1hValsShuffle({2, 3, 4, 5, 6, -2, -3, -4, -5, -6}) → t1kValsRandom(1, 4) → caseNumJoin({Zip[Element[transVectors, A], A, questionOrder], Zip[Element[transVectors, B], B, matchOrder]}) → displayOrderIf(Random[0, 1] ≟ 1, 1, -1) → aIf(Random[0, 1] ≟ 1, 1, -1) → bLaTeX((((("\text{\textbf{Question: }" * QUESTION) * "\\\textbf{Instructions: }") * INSTRUCTIONS) * "}")) → allInstrucTranslate(polygonTemplate, Vector[Element[displayOrder, 1]]) → graph1Translate(polygonTemplate, Vector[Element[displayOrder, 2]]) → graph2Translate(polygonTemplate, Vector[Element[displayOrder, 3]]) → graph3Translate(polygonTemplate, Vector[Element[displayOrder, 4]]) → graph4UnicodeToLetter(10003) → cmarkUnicodeToLetter(10007) → xmarkTranslate(polygonTemplate, Vector[Element[displayOrder, 5]]) → graph5Translate(polygonTemplate, Vector[Element[displayOrder, 6]]) → graph6Shuffle({-2, -3, -4, -6}) → r1ValsJoin({Sequence[Segment[(-11, i), (11, i)], i, -10, 10], Sequence[Segment[(i, -11), (i, 11)], i, -10, 10]}) → TemplateGridShuffle({1, 2, 3, 4, 5, 6}) → r2ValsTranslate(polygonTemplate, Vector[Element[displayOrder, graphChosen]]) → highlightQuestionSequence(i + 3 ≟ Element[matches, i], i, 1, 3) → correctMatchesTranslate(polygonTemplate, Element[displayOrder, 1]) → q1BoxTranslate(polygonTemplate, Element[displayOrder, 2]) → q2BoxTranslate(polygonTemplate, Element[displayOrder, 3]) → q3BoxTranslate(polygonTemplate, Element[displayOrder, Element[matches, 3]]) → q3MatchingBoxTranslate(polygonTemplate, Element[displayOrder, Element[matches, 2]]) → q2MatchingBoxTranslate(polygonTemplate, Element[displayOrder, Element[matches, 1]]) → q1MatchingBoxRandom(c2 + 1, c2 + 4) → d2Random(1, 3) → t1IndxElement(t2Funcs, t2Indx) → t2FuncDerivative(t2Func) → t2DerivativeIntersect(t3Base, (t3multiplier * 11), t3var2 + 0.1, 11) → t3RightBoundaryZip(Derivative[A], A, t1Funcs) → t1DerivativesJoin({t1Funcs, t1Derivatives}) → t1AllFuncsZip(Sort[{Intersect[A, polygonTemplate]}], A, t1AllFuncs) → t1endPointsZip(If[x > x(Element[B, 1]) ∧ x < x(Element[B, 2]), C(x)], B, t1endPoints, C, t1AllFuncs) → t1FuncsRestrictedElement(t1FuncsRestricted, t1Indx) → t1FuncElement(t1FuncsRestricted, t1Indx + 3) → t1DerivativeRandom(1, 2) → t3IndxIf(t3Indx ≟ 1, t3Restricted1, t3Restricted2) → t3FuncIf(t3Indx ≟ 1, t3Derivative1, t3Derivative2) → t3DerivativeZip(Translate[A, Vector[D]], A, {t1Func, t2Func, t3Func}, D, displayOrder) → funcSegmentsRow1Zip(Translate[A, Vector[D]], A, {t1Derivative, t2Derivative, t3Derivative}, D, Take[displayOrder, 4]) → funcSegmentsRow2Zip(Translate[TemplateGrid, Vector[A]], A, Take[transVectors, 1, 3]) → allGridsRow1Zip({Roots[A, -10, 10]}, A, t1Derivatives) → t1zerosLaTeX(If[Length[t21zeros] > 0 ∧ Defined[Element[t21zeros, 1]], fbt21WithZeros, fbt21NoZeros]) → fbt21If(t1Indx ≟ 1, fbt11, If[t1Indx ≟ 2, fbt12, fbt13]) → fbt1If(t2Indx ≟ 1, fbt21, fbt22) → fbt2If(t3Indx ≟ 1, fbt31, fbt32) → fbt3Translate(Flatten[Zip[{(x(A), Slope[Line[A, B]]), (x(B), Slope[Line[A, B]])}, A, t22Points, B, Take[t22Points, 2]]], Element[displayOrder, 5]) → t22DerivativeEndPointsJoin({TemplateAxisArrows, {Zip[Segment[(A, -0.3), (A, 0.3)], A, {-10, -5, 5, 10}], Zip[Segment[(0.3, B), (-0.3, B)], B, {10, 5, -5, -10}], {Segment[(-11, 0), (11, 0)], Segment[(0, -11), (0, 11)]}}}) → TemplateAxisZip(Translate[TemplateGrid, Vector[A]], A, Take[transVectors, 4, 6]) → allGridsRow2Zip(Translate[TemplateAxis, Vector[A]], A, Take[transVectors, 1, 3]) → allAxesRow1Zip(Translate[TemplateAxis, Vector[A]], A, Take[transVectors, 4, 6]) → allAxesRow2Zip(Zip[Text[A, B + V, true, true], A, {"-10", "-5", "5", "10", "x", "-10", "-5", "5", "10", "y"}, B, TemplateTxtLocations], V, Take[transVectors, 4, 6]) → allAxisLabelsRow2Zip(Zip[Text[A, B + V, true, true], A, {"-10", "-5", "5", "10", "x", "-10", "-5", "5", "10", "y"}, B, TemplateTxtLocations], V, Take[transVectors, 1, 3]) → allAxisLabelsRow1Zip(Text[A, (2, 14.5) + V, true, true], A, graphTitles, V, transVectors) → allTitlesLaTeX(("\text{\textbf{Feedback: } (A checkmark in a column indicates a correct match.)\\" * If[IndexOf[fbIndx, questionOrder] ≟ 1, fbt1, If[IndexOf[fbIndx, questionOrder] ≟ 2, fbt2, fbt3]])) → fbDisplayZip(Text[If[A, "", ("" * xmark)], V + (7.5, 14.2), true, true], A, correctMatches, V, displayOrder) → xMarksZip(Text[If[A, ("" * cmark)], V + (7.5, 14.2), true, true], A, correctMatches, V, displayOrder) → checkMarks
AI 绘图提示语参考
绘制一个包含多个函数图像及其导数的图形,展示函数与其导数的关系。首先创建一个坐标轴,然后在坐标轴上随机生成几个函数和它们的导数,并标出函数和导数的零点。将这些函数和导数的图像以及零点信息组合在一起,形成一个匹配游戏,让用户识别哪些图像属于同一函数及其导数。最后,将所有这些元素排列在一个网格中,突出显示其中一个函数及其导数,以便用户进行比较和匹配。
以上提示语为根据原始绘图命令整理而来,仅供参考。