
线性方程组与函数图像
几何画板及绘图内容加载中,请稍等……
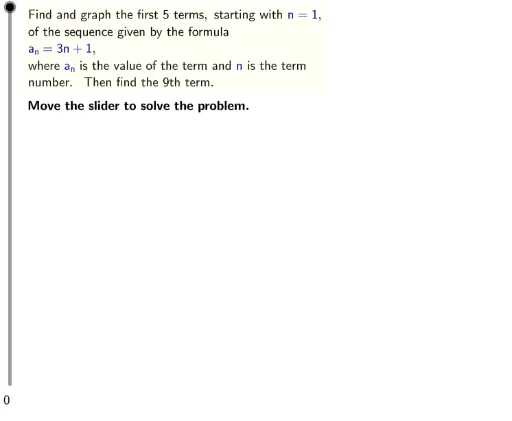
该范例演示了如何通过GeoGebra绘制线性方程组的图像,并分析其解的情况。核心数学概念包括线性方程、函数图像、连续性等。通过使用LaTeX、Sequence、TableText等命令,用户可以动态调整系数,观察方程组解的变化。适合高中数学教学和学习。
GeoGebra 命令及参数
LaTeX(steps) → counterLaTeX("\text{Move the slider to solve the problem.}") → text0LaTeX("\text{Use the buttons below to return to the original}\cr\text{problem or randomly generate a similar practice}\cr\text{problem.}") → RandomizationTextCorner(2, 3) → toprightCorner(2, 1) → bottomleftIf(const > 0, "+", "-") → constSignIf(choose ≟ 0, LaTeX[(((("a_n=" * coef) * "n") * constSign) * absConst)], LaTeX[(((((("a_n=" * coef) * "a_{n-1}") * constSign) * absConst) * "\text{ and }a_0=") * const)]) → formulaIf(choose ≟ 0, explicit, recursive) → sequenceValsSequence((n(j), sequenceVals(j)), j, 1, graphterms) → plotPointsLaTeX("\text{Determine whether this is an explicit formula or a}\cr\text{recursive formula.}") → text1LaTeX((((((("\text{Find and graph the first " * graphterms) * " terms, starting with }\textcolor{#000099}{n=1}\text{,}\cr\text{of the sequence given by the formula }\cr\textcolor{#000099}{") * formula) * "}\text{,}\cr\text{where }\textcolor{#000099}{a_n}\text{ is the value of the term and }\textcolor{#000099}{n}\text{ is the term}\cr\text{number. Then find the ") * finalterm) * "th term.}")) → ProblemIf(choose ≟ 0, LaTeX["\text{This is an explicit formula because the right hand}\cr\text{side depends only on }\textcolor{#000099}{n}\text{ and not on }\textcolor{#000099}{a_{n-1}}\text{ or similar}\cr\text{terms.}"], LaTeX["\text{This is a recursive formula because the right hand}\cr\text{side depends on }\textcolor{#000099}{a_{n-1}}\text{ and we are given an initial}\cr\text{term, }\textcolor{#000099}{a_0}\text{.}"]) → text2LaTeX((("\text{Find the first " * graphterms) * " terms of the sequence.}")) → text3If(choose ≟ 0, Sequence[LaTeX[(((((((((("a_" * k) * "=") * coef) * "(") * k) * ")") * constSign) * absConst) * "=") * sequenceVals(k))], k, 1, graphterms], Append[LaTeX[(((((((("a_1=" * coef) * "(") * const) * ")") * constSign) * absConst) * "=") * sequenceVals(1))], Sequence[LaTeX[(((((((((("a_" * k) * "=") * coef) * "(") * sequenceVals(k - 1)) * ")") * constSign) * absConst) * "=") * sequenceVals(k))], k, 2, graphterms]]) → firstTermsLaTeX((("\text{Substitute the respective values for }\textcolor{#000099}{n=1}\text{ through }\cr\textcolor{#000099}{n=" * graphterms) * "}\text{.}")) → text4LaTeX(formula) → text4bTableText({firstTerms}, "v") → text4cSequence(sequenceVals(k), k, 1, graphterms - 1) → shortListLaTeX("\text{Create ordered pairs from the sequence.}") → text5LaTeX("\text{The first coordinate is }\textcolor{#000099}{n}\text{ and the second coordinate}\cr\text{is }\textcolor{#000099}{a_n}\text{.}") → text6LaTeX("\text{Plot the ordered pairs.}") → text8LaTeX((("\text{Find the " * finalterm) * "th term in the sequence.}")) → text9If(choose ≟ 0, LaTeX[(((("\text{Since the sequence is explicitly defined, evaluate}\cr\text{the formula, }\textcolor{#000099}{" * formula) * "}\text{ at }\textcolor{#000099}{n=") * finalterm) * "}\text{.}")], LaTeX[(("\text{Since the sequence is recursively defined, continue}\cr\text{building up to the " * finalterm) * "th term one term at a time.}")]) → text10aSequence(sequenceVals(k), k, 1, graphterms) → graphedListMax(0, Max[graphedList]) → maxySequence(LaTeX[(((((((((("a_" * k) * "=") * coef) * "(") * sequenceVals(k - 1)) * ")") * constSign) * absConst) * "=") * sequenceVals(k))], k, graphterms + 1, finalterm) → moreTermsIf(choose ≟ 0, LaTeX[(((((((((("a_" * finalterm) * "=") * coef) * "(") * finalterm) * ")") * constSign) * const) * "=") * sequenceVals(finalterm))], TableText[{moreTerms}, "v"]) → text10bLaTeX((((("\text{The " * finalterm) * "th term in the sequence is ") * sequenceVals(finalterm)) * ".}")) → text10cLaTeX((((((("\text{" * text10a) * "}\cr\textcolor{#000099}{") * text10b) * "}\cr\text{") * text10c) * "}")) → text10LaTeX((((((("\text{The first " * graphterms) * " values are ") * shortList) * "}\cr\text{and ") * sequenceVals(graphterms)) * ".}")) → text4dTableText({Append[LaTeX["(n,a_n)"], plotPoints]}, "v") → text7Min(0, Min[graphedList]) → miny