
综合几何与函数图像示例:多边形、参数曲线与体积计算
几何画板及绘图内容加载中,请稍等……
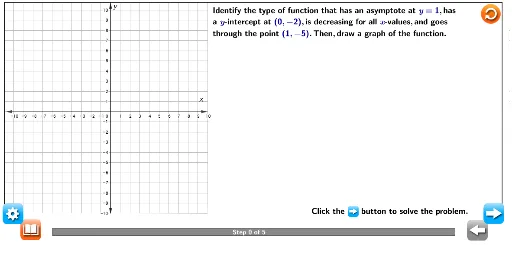
①本范例演示了一个结合指数函数、参数曲线、多边形、柱状图与体积计算的综合数学构造,通过GeoGebra交互界面展示多个数学对象的关联。②核心概念包括指数函数图像、参数曲线、一般四边形、向量减法、柱状图(条形图)以及体积的几何意义,涉及函数、几何与代数多个分支。③作图要点:从构造摘要可见,使用了Point(点)、Segment(线段)、Intersect(交点)、Vector(向量)、LaTeX(公式标注)、Polygon(多边形)等命令,并创建了大量对象(如A至Z、P、Q等),可能用于构建动态图形、按钮(如Reset、Originalbutton)和交互控件(如probar),以控制参数或显示不同状态。④适合高中或大学低年级学生,用于探索函数与几何的整合、参数化表示以及体积的直观理解,也可作为教师制作交互式数学课件的参考。
GeoGebra 命令及参数
Point(p_1) → P_1Point(xAxis) → BSegment(W, Z) → pIntersect(xAxis, yAxis) → D_1Point(yAxis) → E_1Vector(D_1, E_1) → wPoint(xAxis) → F_1Vector(D_1, F_1) → u_1Point(yAxis) → G_1Vector(D_1, G_1) → v_1Point(xAxis) → H_1Vector(D_1, H_1) → w_1LaTeX("\text{Identify the type of function.}") → text1_2LaTeX((("\text{Step {" * Slider) * "} of 5}")) → text1_5LaTeX("\text{\mathbf{Note}\mathbf{:} Use the (Data Kit) \\to return to the original \\problem or randomly generate \\a similar practice problem.\\Use the (Definition) to \\review words to know.}") → text2LaTeX("\text{Click the button to solve the problem.}") → text8LaTeX("\text{Draw the asymptote and the two given points on a coordinate plane.}") → text1_3Point(h_1) → J_1Point(h_1) → K_1Segment(J_1, K_1) → fPoint(i_1) → L_1Point(i_1) → M_1Segment(L_1, M_1) → asymptoteLaTeX((((((("\text{Identify the type of function that has an asymptote at \textcolor{#000099}{\mathit{y}={" * as) * "}},has\\a \textcolor{#000099}{\mathit{y}}-intercept at \textcolor{#000099}{(0, {") * y1) * "})},is decreasing for all \textcolor{#000099}{\mathit{x}}-values,and goes\\through the point \textcolor{#000099}{(1,{") * y2) * "})}.Then,draw a graph of the function.}")) → text1LaTeX("\text{Because there is an asymptote and a \textcolor{#000099}{\mathit{y}}-intercept,the function\\is exponential.}") → text1_1LaTeX((("\text{Asymptote at \textcolor{#000099}{\mathit{y}={" * as) * "}}")) → text3LaTeX("\text{\mathit{x}}") → text7LaTeX("\text{\mathit{y}}") → text7_1LaTeX("\text{\mathbf{Asymptote:} An asymptote is a value that you get closer and closer to,but\\ never quite reach.}") → text6LaTeX((("\text{\mathit{y}-intercepts:\textcolor{#000099}{(0,{" * y1) * "})}")) → text4LaTeX((("\text{Point goes through:\textcolor{#000099}{(0,{" * y2) * "})}")) → text5Polygon(N, Z_1, I_2, J_2, A_2, B_2, C_2, D_2, E_2, F_2, G_2, H_2) → poly1, n, h_2, i_2, j_2, z_1, a_2, b_2, c_2, d_2, e_2, f_2, g_2Point(n) → P_2Point(b_2) → S_2Polygon(K_2, L_2, M_2, N_2, O_2, P_2, Q_2, R_2, S_2) → poly2, k_2, l_2, m_2, n_2, o_2, p_2, q_2, r_2, s_2Intersect(a_2, b_2) → W_2Point(r_2) → Z_2Polygon(T_2, U_2, N_2, V_2, W_2, Z_2) → poly3, t_2, u_2, n_1, v_2, w_2, z_2LaTeX("\text{\mathbf{Point :} A point on the coordinate plane is a location defined by an \\ ordered pair of the form (x,y).}") → text6_1LaTeX("\text{Graph the given key features.}") → text1_4LaTeX("\text{Graph the function. \\Because the function is decreasing and can’t go beyond the asymptote,\\we can roughly draw in the curve required.}") → text1_6
AI 绘图提示语参考
在坐标平面上绘制一个综合数学图形:包含一条指数函数曲线及其渐近线,标出y截距和经过的点;同时绘制一条参数曲线;构造多个多边形(包括四边形和六边形),并利用向量表示坐标轴上的位移;添加柱状图以展示体积概念;在图中放置文本标签,说明函数类型、渐近线、截距等关键特征,并设置交互按钮和滑块以调整参数或显示步骤。
以上提示语为根据原始绘图命令整理而来,仅供参考。